


The nautical market reaches 4,506 enrolments until September
The nautical market reaches 4,506 enrolments until September
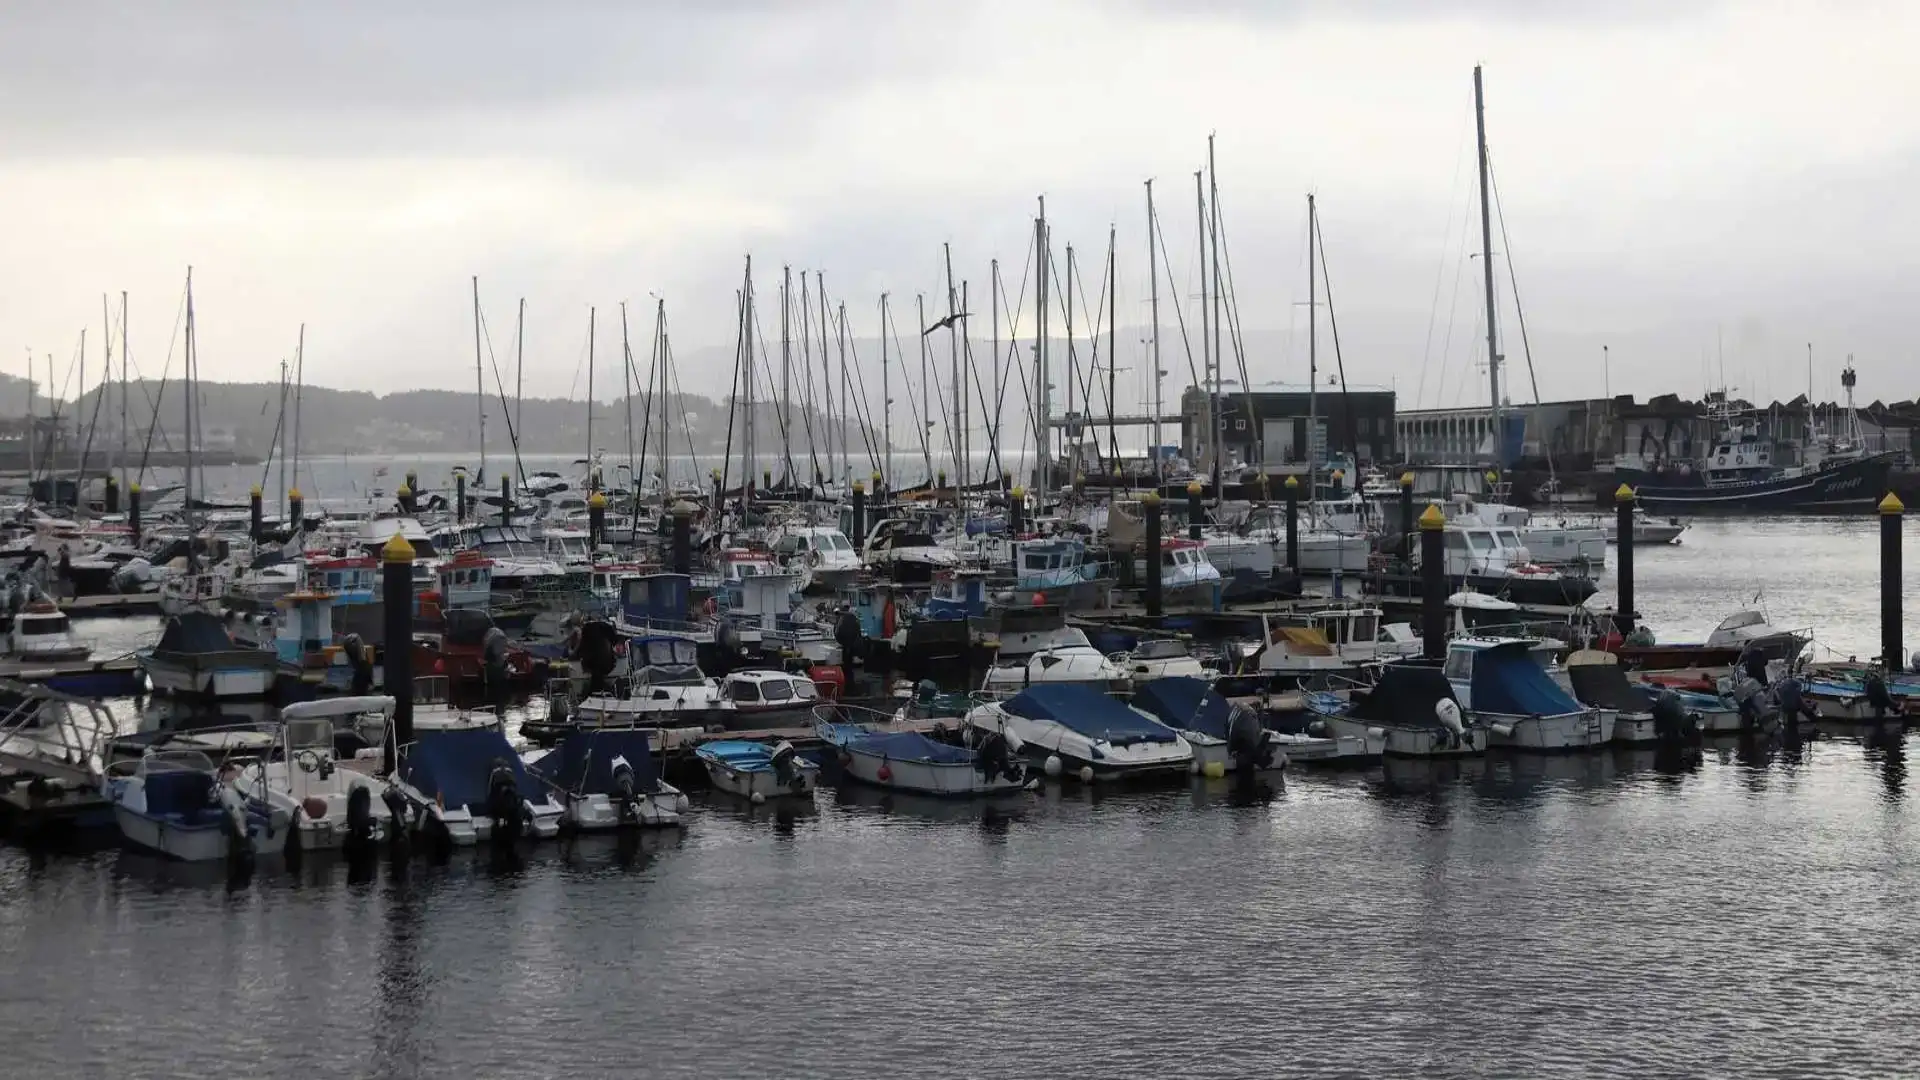
These are the data collected in the "Report of the market for recreational craft. Enero- September 2024," edited by ANEN from the data provided by the General Directorate of the Merchant Navy (Photo Moebius)
From January to September this year, 4,506 recreational boats have been registered, 947 less than those registered in the same period last year. An average fall that continues throughout the year and is concentrated mainly in the segment of length up to 6 meters and in the markets of water bikes and folding pneumatic boats.
The boats over 16 meters maintain the good behavior of the previous months and record an increase in the registration of the ships, from this length, of 14.6% in that accumulated this year.
In the rental market (nautical charter), 1,638 recreational vessels have been registered from January to September of this year compared with 1,965 in the same period of 2023.
Of the total number of vessels registered from January to September, 64% are for private-use vessels and 36% for vessels for the nautical charter.
NATIONAL NATIC MARKET DATA
By length
The smaller boats, up to 6 meters, continue to show the greatest drop in enrolment (-20.3%) in the year. In positive terms, the registration of ships more than 16 meters, with an increase of 14.6% in the period under review (energy-September 2024), continues.
| Length | 2022 | 2023 | 2024 | % ^ 22 | % ^ 23 | % 22 / Tot. | % 23 / Tot. | % 24 / Tot. |
| Up to 6 m | 3,520 | 3,960 | 3.158 | -10.3% | -20.3% | 67.7% | 72.6% | 70,1% |
| 6 to 8 m | 1,023 | 923 | 811 | -20.7% | -12.1% | 19.7% | 16.9% | 18.0% |
| 8 to 12 m | 451 | 387 | 366 | -18.8% | -5.4% | 8.7% | 7.1% | 8.1% |
| 12 to 16 m | 143 | 142 | 124 | -13.3% | -12.7% | 2.8% | 2.6% | 2.8% |
| More than 16 m | 63 | 41 | 47 | -25.4% | 14.6% | 1.2% | 0.8% | 1.0% |
| Total | 5,200 | 5,453 | 4.506 | -13.3% | -17.4% | 100.0% | 100.0% | 100.0% |
By type of vessel
The largest drop in enrolment is concentrated on folding pneumatic vessels
(-43%) and water bikes (-19.8%).
| Market | 2022 | 2023 | 2024 | % ^ 22 | % ^ 23 | % 22 / Tot. | % 23 / Tot. | % 24 / Tot. |
| METHODS OF WATER | 1.120 | 1,849 | 1.482 | 32.3% | -19.8% | 21.5% | 33.9% | 32.9% |
| BLOOD TO MOTOR | 2,481 | 2,053 | 1,870 | -24.6% | -8.9% | 47.7% | 37.6% | 41.5% |
| NEUMATIS | 501 | 666 | 379 | -24.4% | -43.1% | 9.6% | 12.2% | 8.4% |
| SEMIRRIGID NEUMATIS | 700 | 592 | 531 | -24.1% | -10.3% | 13.5% | 10.9% | 11.8% |
| VELA | 398 | 293 | 244 | -38.7% | -16.7% | 7.7% | 5.4% | 5.4% |
| Total | 5,200 | 5,453 | 4.506 | -13.3% | -17.4% | 100.0% | 100.0% | 100.0% |
Enrolment by province
The autonomous coastal communities with the greatest impact on the nautical market lose enrolment, in general, in respect of the same period of 2023, with exceptions such as Cantabria, where 23 more units have been registered in the year's accumulated. They also produce positive coastal provinces such as Valencia with + 45 enrolments, Granada (+ 11) and Guipúzcoa (+ 3).
In the charter market,have a positive behavior the registration of boats for use of rent in Valencia with 38 records more than in the same period of 2023, Cantabria (+ 13), Barcelona (+ 10), (Almería (+ 8), Granada (+ 3), Guipúzcoa (+ 3) and Castellón (+ 1).
ENERGY PROVINCES - SEPTEMBER 2024
| Province | 2023 | 2024 | % ^ 23 | % 23 / Tot. | % 24 / Tot. | |
| A CORUÑA | 142 | 128 | -9.86% | 2.60% | 2.84% | |
| ALAVA | 3 | 4 | 33.33% | 0.06% | 0.09% | |
| ALBACETE | 6 | 3 | -50,00% | 0.11% | 0.07% | |
| ALICANTE | 319 | 227 | -28.84% | 5.85% | 5.04% | |
| ALMERIA | 179 | 157 | -12.29% | 3.28% | 3.48% | |
| ASTURIES | 42 | 29 | -30.95% | 0.77% | 0.64% | |
| AVILA | 4 | 4 | 0,00% | 0.07% | 0.09% | |
| BADAJOZ | 17 | 21 | 23.53% | 0.31% | 0.47% | |
| BARCELONA | 587 | 499 | -14.99% | 10.76% | 11.07% | |
| BURGOS | 3 | 4 | 33.33% | 0.06% | 0.09% | |
| CACRES | 1 | 6 | 500% | 0.02% | 0.13% | |
| CADIZ | 235 | 153 | -34.89% | 4.31% | 3.40% | |
| CANTABRIA | 58 | 81 | 39.66% | 1.06% | 1.80% | |
| CASTELLON | 56 | 54 | -3.57% | 1.03% | 1.20% | |
| CEUTA | 17 | 6 | -64.71% | 0.31% | 0.13% | |
| REAL CITY | 2 | 5 | 150,00% | 0.04% | 0.11% | |
| CORDOBA | 18 | 25 | 38.89% | 0.33% | 0.55% | |
| QUENCA | 3 | 0 | -100,00% | 0.06% | 0,00% | |
| GIRONA | 329 | 300 | -8.81% | 6.03% | 6.66% | |
| GRANADA | 79 | 90 | 13.92% | 1.45% | 2.00% | |
| GUADALAJARA | 6 | 2 | -66.67% | 0.11% | 0.04% | |
| GUIPUZCOA | 35 | 38 | 8.57% | 0.64% | 0.84% | |
| BELVA | 130 | 88 | -32.31% | 2.38% | 1.95% | |
| BESCA | 3 | 2 | -33.33% | 0.06% | 0.04% | |
| BALEAR ISLANDS | 984 | 822 | -16.46% | 18.05% | 18.24% | |
| JAEN | 9 | 8 | -11.11% | 0.17% | 0.18% | |
| THE RIOJA | 8 | 11 | 37.50% | 0.15% | 0.24% | |
| THE PALMAS | 235 | 147 | -37.45% | 4.31% | 3.26% | |
| LEON | 8 | 8 | 0,00% | 0.15% | 0.18% | |
| LLEIDA | 10 | 5 | -50,00% | 0.18% | 0.11% | |
| LIGHT | 18 | 10 | -44.44% | 0.33% | 0.22% | |
| MADRID | 397 | 304 | -23.43% | 7.28% | 6.75% | |
| MALAGA | 335 | 256 | -23.58% | 6.14% | 5.68% | |
| MELILLA | 15 | 18 | 20.00% | 0.28% | 0.40% | |
| MURCIA | 274 | 192 | -29.93% | 5.02% | 4.26% | |
| NAVARRA | 13 | 9 | -30.77% | 0.24% | 0.20% | |
| OURENSE | 7 | 3 | -57.14% | 0.13% | 0.07% | |
| PALENCY | 3 | 0 | -100,00% | 0.06% | 0,00% | |
| PONTEVEDRA | 128 | 107 | -16.41% | 2.35% | 2.37% | |
| SALAMANCA | 2 | 0 | -100,00% | 0.04% | 0,00% | |
| _ | 175 | 170 | -2.86% | 3.21% | 3.77% | |
| SEGOVIA | 1 | 1 | 0,00% | 0.02% | 0.02% | |
| _ | 141 | 102 | -27.66% | 2.59% | 2.26% | |
| SORIA | 0 | 0 | 0,00% | 0,00% | ||
| TARRAGONA | 133 | 105 | -21.05% | 2.44% | 2.33% | |
| TERUEL | 3 | 3 | 0,00% | 0.06% | 0.07% | |
| TOLEDO | 8 | 6 | -25.00% | 0.15% | 0.13% | |
| VALENCE | 160 | 205 | 28.13% | 2.93% | 4.55% | |
| VALLADOLID | 4 | 2 | -50,00% | 0.07% | 0.04% | |
| VIZCAYA | 90 | 69 | -23.33% | 1.65% | 1.53% | |
| ZAMORA | 3 | 1 | -66.67% | 0.06% | 0.02% | |
| ZARAGOZA | 15 | 16 | 6.67% | 0.28% | 0.36% | |
| Total | 5453 | 4506 | -17.4% | 100.0% | 100.0% | |
© 2024 Nautica Digital Europe - www.nauticadigital.eu


