More than 3000 enrolments in the first semester in Spain
More than 3000 enrolments in the first semester in Spain

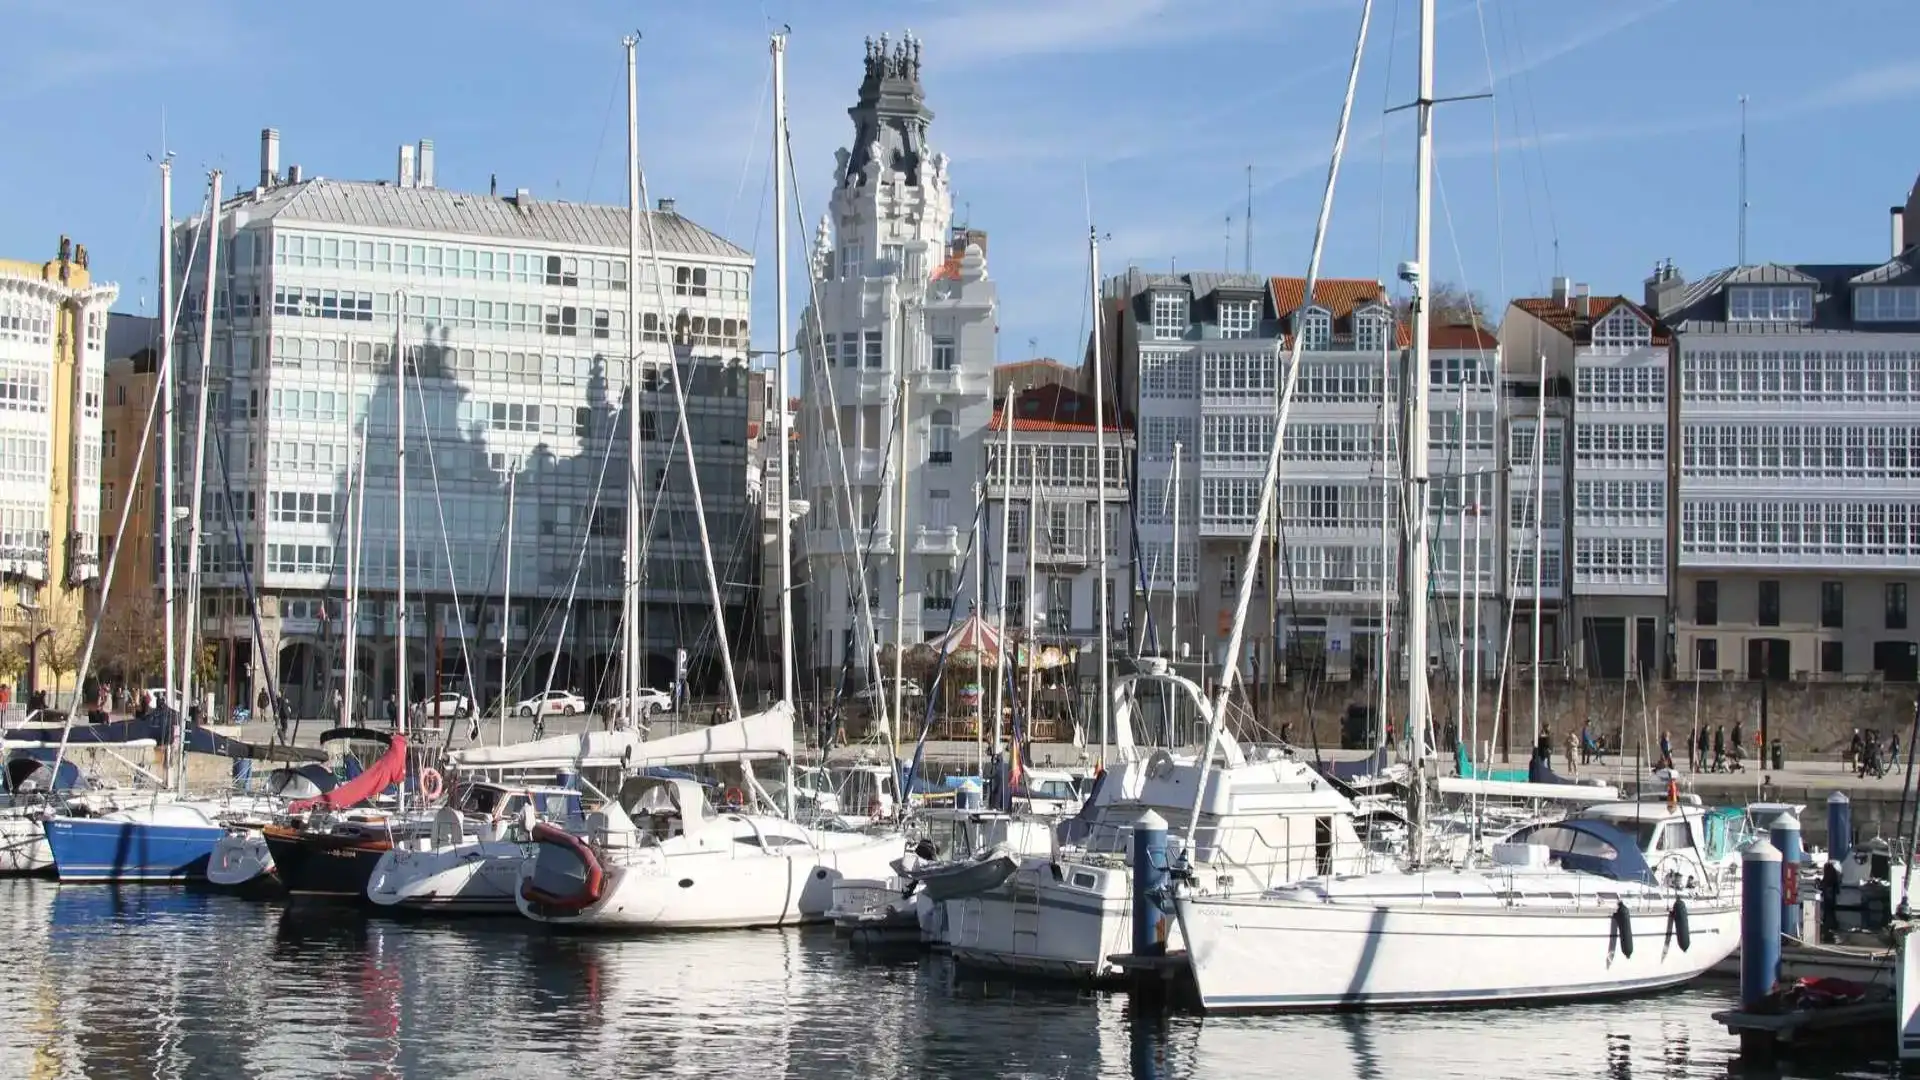
These are the data collected in the "Report of the market for recreational craft. Enero-June 2024," edited by ANEN from the data provided by the General Directorate of the Merchant Navy (Photo Pedro Seoane)
The nautical market has recorded in the first half of the year 3,047 enrolments of recreational boats, are 764 less than those made in the same period (energy-May) of 2023. Following the trend of recent months, the fall is concentrated in the market of nautical motorcycles and in the segment of boats up to 6 meters long. Ships over 16 metres still have positive results, although their impact on the market as a whole is less.
On the rental market, vessels registered for this use during the energy period - June show a decrease of -22%, in line with the general market. Of the total number of vessels registered until May, 62% are for private-use vessels and 38% are for vessels intended for nautical charter.
NATIONAL NATIC MARKET DATA
By length
Water bikes and smaller boats, up to 6 metres, are still the most affected by the decline in enrolment, with a decrease of -23.7% in the cumulative of this first semester. The segment of intermediate length between 8 and 12 meters has a more stable behavior, with a decrease in enrolment of -8.7%. On the positive side, boats over 16 meters are maintained with a 21% increase in enrolment in this period, with 6 more records than those made between January and May last year.
| Length | 2022 | 2023 | 2024 | % ^ 22 | % ^ 23 | % 22 / Tot. | % 23 / Tot. | % 24 / Tot. |
| Up to 6 m | 2.366 | 2,748 | 2,096 | -11.4% | -23.7% | 66.6% | 72.1% | 68.8% |
| 6 to 8 m | 713 | 664 | 588 | -17.5% | -11.4% | 20.1% | 17.4% | 19.3% |
| 8 to 12 m | 320 | 276 | 252 | -21.3% | -8.7% | 9.0% | 7.2% | 8.3% |
| 12 to 16 m | 110 | 95 | 77 | -30.0% | -18.9% | 3.1% | 2.5% | 2.5% |
| More than 16 m | 43 | 28 | 34 | -20.9% | 21.4% | 1.2% | 0.7% | 1.1% |
| Total | 3,552 | 3,811 | 3,047 | -14.2% | -20.0% | 100.0% | 100.0% | 100.0% |
By type of vessel
The fall in enrolment affects all markets, with the highest incidence of the folding pneumatic vessels (-39.6%) and of the water bikes (-27.8%)
| Market | 2022 | 2023 | 2024 | % ^ 22 | % ^ 23 | % 22 / Tot. | % 23 / Tot. | % 24 / Tot. | |
| METHODS OF WATER | 753 | 1.359 | 981 | 30.3% | -27.8% | 21.2% | 35.7% | 32.2% | |
| BLOOD TO MOTOR | 1,740 | 1.468 | 1,314 | -24.5% | -10.5% | 49.0% | 38.5% | 43.1% | |
| NEUMATIS | 288 | 396 | 239 | -17.0% | -39.6% | 8.1% | 10.4% | 7.8% | |
| SEMIRRIGID NEUMATIS | 477 | 374 | 339 | -28.9% | -9.4% | 13.4% | 9.8% | 11.1% | |
| VELA | 294 | 214 | 174 | -40.8% | -18.7% | 8.3% | 5.6% | 5.7% | |
| Total | 3,552 | 3,811 | 3,047 | -14.2% | -20.0% | 100.0% | 100.0% | 100.0% |
Enrolment by province
The autonomous communities with the greatest impact on the nautical market lose enrollments over the same period of 2023, with some exception for provinces such as Cantabria which is growing by 59%, with 59 enrollments compared to 37 registered in the same period of 2023 and Valencia which is growing by 18.75%. from 112 to 133 registered vessels.
In the charter marketIt is worth noting the growth of enrolment for this use in Cantabria, Valencia and Almería.
PROVINCES MATRICULATIONS (ENERO-JUNE 2024).
| Province | 2023 | 2024 | % ^ 23 | % 23 / Tot. | % 24 / Tot. |
| A CORUÑA | 94 | 86 | -8.51% | 2.47% | 2.82% |
| ALAVA | 3 | 3 | 0,00% | 0.08% | 0.10% |
| ALBACETE | 5 | 3 | -40,00% | 0.13% | 0.10% |
| ALICANTE | 239 | 147 | -38.49% | 6.27% | 4.82% |
| ALMERIA | 111 | 103 | -7.21% | 2.91% | 3.38% |
| ASTURIES | 28 | 21 | -25.00% | 0.73% | 0.69% |
| AVILA | 4 | 4 | 0,00% | 0.10% | 0.13% |
| BADAJOZ | 13 | 13 | 0,00% | 0.34% | 0.43% |
| BARCELONA | 416 | 329 | -20.91% | 10.92% | 10.80% |
| BURGOS | 2 | 3 | 50,00% | 0.05% | 0.10% |
| CACRES | 0 | 4 | 0,00% | 0.13% | |
| CADIZ | 151 | 98 | -35.10% | 3.96% | 3.22% |
| CANTABRIA | 37 | 59 | 59.46% | 0.97% | 1.94% |
| CASTELLON | 45 | 36 | -20.00% | 1.18% | 1.18% |
| CEUTA | 9 | 2 | -77.78% | 0.24% | 0.07% |
| REAL CITY | 1 | 4 | 300,00% | 0.03% | 0.13% |
| CORDOBA | 15 | 19 | 26.67% | 0.39% | 0.62% |
| QUENCA | 2 | 0 | -100,00% | 0.05% | 0,00% |
| GIRONA | 256 | 219 | -14.45% | 6.72% | 7.19% |
| GRANADA | 53 | 60 | 13.21% | 1.39% | 1.97% |
| GUADALAJARA | 4 | 2 | -50,00% | 0.10% | 0.07% |
| GUIPUZCOA | 30 | 27 | -10.00% | 0.79% | 0.89% |
| BELVA | 100 | 56 | -44.00% | 2.62% | 1.84% |
| BESCA | 3 | 1 | -66.67% | 0.08% | 0.03% |
| BALEAR ISLANDS | 685 | 601 | -12.26% | 17.97% | 19.72% |
| JAEN | 8 | 5 | -37.50% | 0.21% | 0.16% |
| THE RIOJA | 5 | 11 | 120.00% | 0.13% | 0.36% |
| THE PALMAS | 156 | 107 | -31.41% | 4.09% | 3.51% |
| LEON | 6 | 4 | -33.33% | 0.16% | 0.13% |
| LLEIDA | 9 | 4 | -55.56% | 0.24% | 0.13% |
| LIGHT | 12 | 7 | -41.67% | 0.31% | 0.23% |
| MADRID | 259 | 193 | -25.48% | 6.80% | 6.33% |
| MALAGA | 237 | 156 | -34.18% | 6.22% | 5.12% |
| MELILLA | 9 | 10 | 11.11% | 0.24% | 0.33% |
| MURCIA | 188 | 139 | -26.06% | 4.93% | 4.56% |
| NAVARRA | 9 | 6 | -33.33% | 0.24% | 0.20% |
| OURENSE | 2 | 1 | -50,00% | 0.05% | 0.03% |
| PALENCY | 3 | 0 | -100,00% | 0.08% | 0,00% |
| PONTEVEDRA | 89 | 64 | -28.09% | 2.34% | 2.10% |
| SALAMANCA | 1 | 0 | -100,00% | 0.03% | 0,00% |
| _ | 111 | 117 | 5.41% | 2.91% | 3.84% |
| SEGOVIA | 1 | 1 | 0,00% | 0.03% | 0.03% |
| _ | 104 | 59 | -43.27% | 2.73% | 1.94% |
| SORIA | 0 | 0 | 0,00% | 0,00% | |
| TARRAGONA | 102 | 69 | -32.35% | 2.68% | 2.26% |
| TERUEL | 2 | 1 | -50,00% | 0.05% | 0.03% |
| TOLEDO | 6 | 5 | -16.67% | 0.16% | 0.16% |
| VALENCE | 112 | 133 | 18.75% | 2.94% | 4.36% |
| VALLADOLID | 3 | 0 | -100,00% | 0.08% | 0,00% |
| VIZCAYA | 61 | 45 | -26.23% | 1.60% | 1.48% |
| ZAMORA | 1 | 1 | 0,00% | 0.03% | 0.03% |
| ZARAGOZA | 9 | 9 | 0,00% | 0.24% | 0.30% |
| Total | 3811 | 3047 | -20.0% | 100.0% | 100.0% |
© 2024 Nautica Digital Europe - www.nauticadigital.eu


