


525 registration of recreational boats until the end of february
525 registration of recreational boats until the end of february
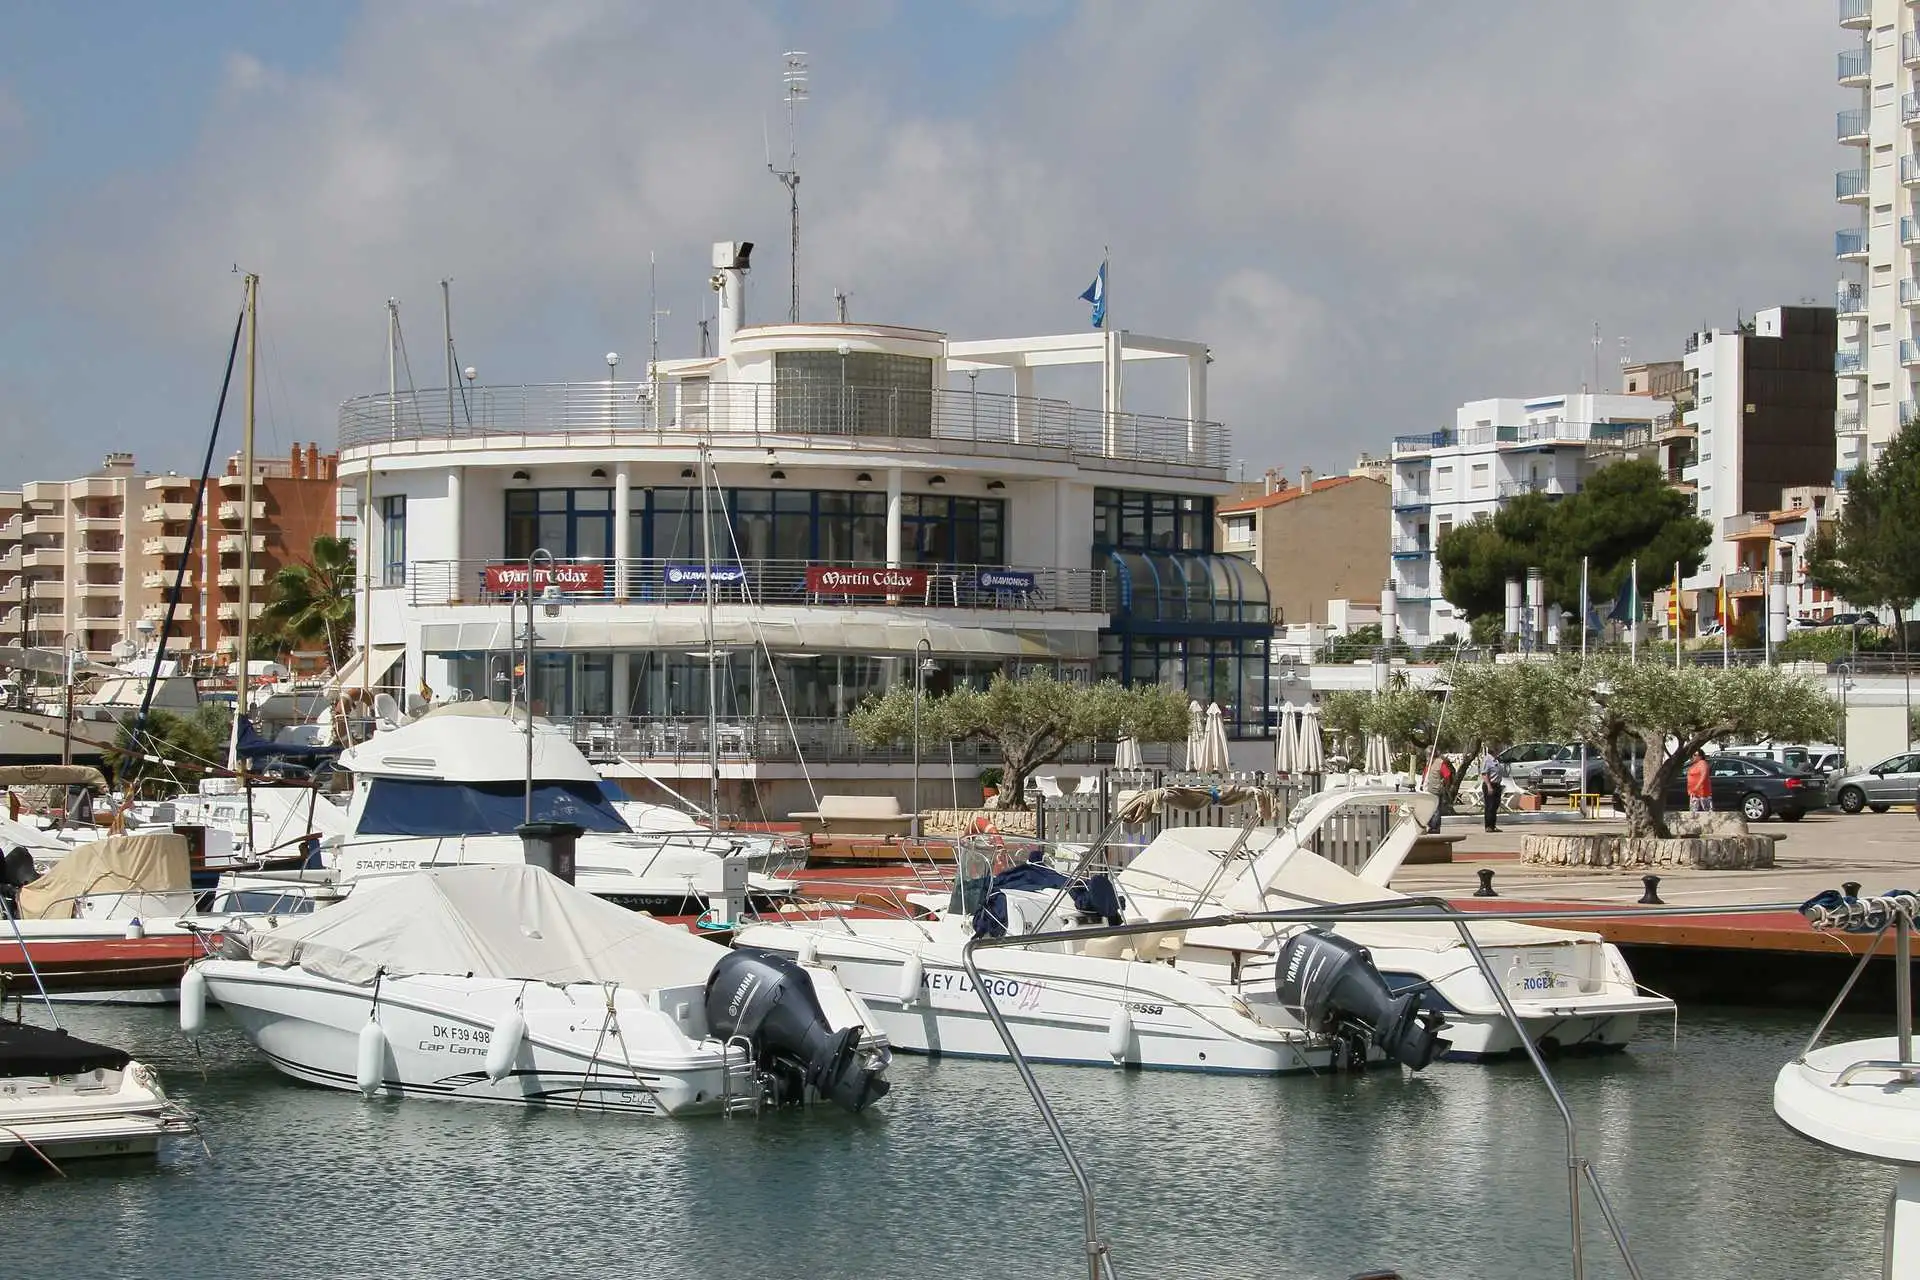
These are the data collected in the "Report of the market for recreational craft. Enero-February 2024," edited by ANEN from the data provided by the General Directorate of the Merchant Navy (Photo Pedro Seoane)
The nautical market has recorded 535 registration of recreational boats in the computation of the first two months of 2024, accusing the decrease in sales that has been taking place since mid-last year on the ships of length less than 8 meters and motorcycles of water and in the segment between 12 and 16 meters. For their part, vessels over 16 metres long improve their enrolment.
Of the total number of vessels registered until the end of February, 68% are for private-use vessels and 32% for vessels intended for the nautical charter that continues to increase their market share.
NATIONAL NATIC MARKET DATA
By length
The segment of ships up to 8 meters is the most affected by the decrease in sales on the nautical market in the year, with an average fall of 18%, followed by the ships between 12 and 16 meters that also have a decrease in enrolment of 14%. In positive terms, the registration of ships is between 8 and 12 meters (+ 2%) and the vessels over 16 meters that register 4 units more than in 2023.
| Length | 2022 | 2023 | 2024 | % ^ 22 | % ^ 23 | % 22 / Tot. | % 23 / Tot. | % 24 / Tot. |
| Up to 6 m | 391 | 469 | 379 | -3.1% | -19.2% | 65.2% | 73.2% | 70.8% |
| 6 to 8 m | 126 | 107 | 88 | -30.2% | -17.8% | 21.0% | 16.7% | 16.4% |
| 8 to 12 m | 62 | 47 | 48 | -22.6% | 2.1% | 10.3% | 7.3% | 9.0% |
| 12 to 16 m | 14 | 14 | 12 | -14.3% | -14.3% | 2.3% | 2.2% | 2.2% |
| More than 16 m | 7 | 4 | 8 | 14.3% | 100.0% | 1.2% | 0.6% | 1.5% |
| Total | 600 | 641 | 535 | -10.8% | -16.5% | 100.0% | 100.0% | 100.0% |
By type of vessel
The motor and pneumatic semi-rigid ships record growth in enrolment. The candle returns to the positive figures in this period, after several months in decline.
For their part, water and folding pneumatic motorcycles have significant declines in enrolment.
| Market | 2022 | 2023 | 2024 | % ^ 22 | % ^ 23 | % 22 / Tot. | % 23 / Tot. | % 24 / Tot. |
| METHODS OF WATER | 135 | 206 | 133 | -1.5% | -35.4% | 22.5% | 32.1% | 24.9% |
| BLOOD TO MOTOR | 270 | 254 | 256 | -5.2% | 0.8% | 45.0% | 39.6% | 47.9% |
| NEUMATIS | 69 | 87 | 41 | -40.6% | -52.9% | 11.5% | 13.6% | 7.7% |
| SEMIRRIGID NEUMATIS | 64 | 57 | 67 | 4.7% | 17.5% | 10.7% | 8.9% | 12.5% |
| VELA | 62 | 37 | 38 | -38.7% | 2.7% | 10.3% | 5.8% | 7.1% |
| Total | 600 | 641 | 535 | -10.8% | -16.5% | 100.0% | 100.0% | 100.0% |
Enrolment by province
Andalusia (21.32%) occupies the largest share of the nautical market, followed by the Balearic Islands (17.76%) and Catalonia (15.5%), in the cumulative of the first two months of 2024.
In the charter market,the Balearic Islands lead this market, with a share of 28.7%, followed by Catalonia (20.5%) and the Valencia Community (12.86%).
Enrolment of recreational boats by province - February 2024
Source: ANEN with DGMM data
| Province | 2023 | 2024 | % ^ 23 | % 23 / Tot. | % 24 / Tot. |
| A CORUÑA | 18 | 29 | 61.11% | 2.81% | 5.42% |
| ALAVA | 1 | 0 | -100,00% | 0.16% | 0,00% |
| ALBACETE | 0 | 0 | 0,00% | 0,00% | |
| ALICANTE | 44 | 31 | -29.55% | 6.86% | 5.79% |
| ALMERIA | 23 | 19 | -17.39% | 3.59% | 3.55% |
| ASTURIES | 5 | 7 | 40,00% | 0.78% | 1.31% |
| AVILA | 1 | 2 | 100,00% | 0.16% | 0.37% |
| BADAJOZ | 3 | 2 | -33.33% | 0.47% | 0.37% |
| BARCELONA | 77 | 42 | -45.45% | 12.01% | 7.85% |
| BURGOS | 0 | 2 | 0,00% | 0.37% | |
| CADIZ | 37 | 21 | -43.24% | 5.77% | 3.93% |
| CANTABRIA | 7 | 9 | 28.57% | 1.09% | 1.68% |
| CASTELLON | 5 | 1 | -80,00% | 0.78% | 0.19% |
| CEUTA | 1 | 0 | -100,00% | 0.16% | 0,00% |
| REAL CITY | 0 | 1 | 0,00% | 0.19% | |
| CORDOBA | 3 | 6 | 100,00% | 0.47% | 1.12% |
| GIRONA | 17 | 25 | 47.06% | 2.65% | 4.67% |
| GRANADA | 5 | 7 | 40,00% | 0.78% | 1.31% |
| GUADALAJARA | 2 | 0 | -100,00% | 0.31% | 0,00% |
| GUIPUZCOA | 7 | 3 | -57.14% | 1.09% | 0.56% |
| BELVA | 18 | 16 | -11.11% | 2.81% | 2.99% |
| BALEAR ISLANDS | 89 | 95 | 6.74% | 13.88% | 17.76% |
| JAEN | 2 | 1 | -50,00% | 0.31% | 0.19% |
| THE RIOJA | 0 | 5 | 0,00% | 0.93% | |
| THE PALMAS | 43 | 23 | -46.51% | 6.71% | 4.30% |
| LEON | 1 | 0 | -100,00% | 0.16% | 0,00% |
| LLEIDA | 1 | 0 | -100,00% | 0.16% | 0,00% |
| LIGHT | 2 | 2 | 0,00% | 0.31% | 0.37% |
| MADRID | 36 | 26 | -27.78% | 5.62% | 4.86% |
| MALAGA | 25 | 37 | 48.00% | 3.90% | 6.92% |
| MELILLA | 1 | 1 | 0,00% | 0.16% | 0.19% |
| MURCIA | 35 | 25 | -28.57% | 5.46% | 4.67% |
| NAVARRA | 3 | 2 | -33.33% | 0.47% | 0.37% |
| OURENSE | 1 | 0 | -100,00% | 0.16% | 0,00% |
| PONTEVEDRA | 16 | 16 | 0,00% | 2.50% | 2.99% |
| _ | 28 | 26 | -7.14% | 4.37% | 4.86% |
| _ | 33 | 7 | -78.79% | 5.15% | 1.31% |
| TARRAGONA | 10 | 16 | 60,00% | 1.56% | 2.99% |
| TERUEL | 1 | 0 | -100,00% | 0.16% | 0,00% |
| TOLEDO | 2 | 1 | -50,00% | 0.31% | 0.19% |
| VALENCE | 26 | 24 | -7.69% | 4.06% | 4.49% |
| VIZCAYA | 10 | 4 | -60,00% | 1.56% | 0.75% |
| ZAMORA | 1 | 0 | -100,00% | 0.16% | 0,00% |
| ZARAGOZA | 1 | 1 | 0,00% | 0.16% | 0.19% |
| Total | 641 | 535 | -16.5% | 100.0% | 100.0% |
© 2024 Nautica Digital Europe - www.nauticadigital.eu


