


5,453 units registered this year in Spain until September
5,453 units registered this year in Spain until September
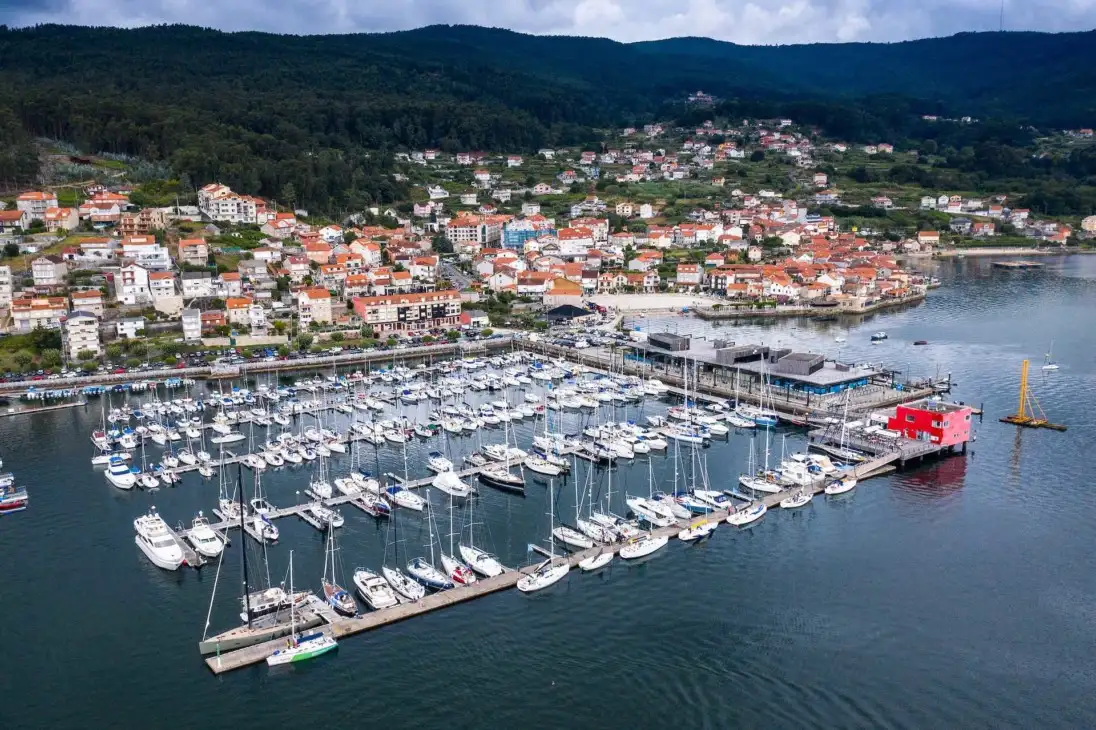
The nautical market has recorded 5,453 registration of recreational boats between January and September of this year, compared to 5,200 in the same period of 2022 (Photo María Muíña)
The smaller boats, the water motorcycles and the nautical charter are still growing in the period under review, according to the data of the "Recreation boat market report.
The report shows that 64 per cent (3,488) of the total enrolment recorded between January and September is for private-use vessels and 36 per cent (1,965) for rental vessels.
The boats up to 6 meters long are the segment that has produced positive data with a growth of 12.5% in enrolment between January and September of this year with respect to the same period of 2022. Enrolments fall for the rest of the length, with better behaviour of the ships between 12 and 16 meters that remain in figures similar to those recorded in the same period last year.
| Length | 2021 | 2022 | 2023 | % ^ 21 | % ^ 22 | % 21 / Tot. | % 22 / Tot. | % 23 / Tot. |
| Up to 6 m | 4,386 | 3,520 | 3,960 | -9.7% | 12.5% | 70,1% | 67.7% | 72.6% |
| 6 to 8 m | 1,071 | 1,023 | 923 | -13.8% | -9.8% | 17.1% | 19.7% | 16.9% |
| 8 to 12 m | 549 | 451 | 387 | -29.5% | -14.2% | 8.8% | 8.7% | 7.1% |
| 12 to 16 m | 193 | 143 | 142 | -26.4% | -0.7% | 3.1% | 2.8% | 2.6% |
| More than 16 m | 59 | 63 | 41 | -30.5% | -34.9% | 0.9% | 1.2% | 0.8% |
| Total | 6,258 | 5,200 | 5,453 | -12.9% | 4.9% | 100.0% | 100.0% | 100.0% |
By type of vessel, water bikes (+ 65%) and folding pneumatic vessels (+ 33%) remain positive, while the rest of the markets lose registration.
| Market | 2021 | 2022 | 2023 | % ^ 21 | % ^ 22 | % 21 / Tot. | % 22 / Tot. | % 23 / Tot. |
| METHODS OF WATER | 1,722 | 1.120 | 1,849 | 7.4% | 65.1% | 27.5% | 21.5% | 33.9% |
| BLOOD TO MOTOR | 2,763 | 2,481 | 2,053 | -25.7% | -17.3% | 44.2% | 47.7% | 37.6% |
| NEUMATIS | 573 | 501 | 666 | 16.2% | 32.9% | 9.2% | 9.6% | 12.2% |
| SEMIRRIGID NEUMATIS | 737 | 700 | 592 | -19.7% | -15.4% | 11.8% | 13.5% | 10.9% |
| VELA | 463 | 398 | 293 | -36.7% | -26.4% | 7.4% | 7.7% | 5.4% |
| Total | 6,258 | 5,200 | 5,453 | -12.9% | 4.9% | 100.0% | 100.0% | 100.0% |
The rental markethas recorded 1,965 (+ 8%) enrollments for this use for the year, compared to 1,820 made between January and September 2022.
By provinceAmong those with the greatest impact on the nautical market, the good behaviour of Malaga, with a growth of 19.64% of the enrolments, also in Madrid there is a growth of 13% of the enrolments.
In the Canary Islands there is a historical growth in enrolment in the year, both in Gran Canaria (92%) and Tenerife (60%).
In Catalonia, with the largest share of the nautical market (19.41%), it is worth noting the growth of enrolment in Barcelona (4.3%) and Tarragona (15.65%).
The Balearic Islands, the second autonomous community with the greatest impact on the nautical market (18%), reduces the decline in enrolment between January and September (-1%).
Enrollment of recreational craft by province - September 2023
Source: ANEN with DGMM data
| Province | 2022 | 2023 | % ^ 22 | % 22 / Tot. | % 23 / Tot. |
| A CORUÑA | 137 | 142 | 3.65% | 2.63% | 2.60% |
| ALAVA | 7 | 3 | -57.14% | 0.13% | 0.06% |
| ALBACETE | 9 | 6 | -33.33% | 0.17% | 0.11% |
| ALICANTE | 328 | 319 | -2.74% | 6.31% | 5.85% |
| ALMERIA | 161 | 179 | 11.18% | 3.10% | 3.28% |
| ASTURIES | 49 | 42 | -14.29% | 0.94% | 0.77% |
| AVILA | 0 | 4 | 0,00% | 0.07% | |
| BADAJOZ | 15 | 17 | 13.33% | 0.29% | 0.31% |
| BARCELONA | 563 | 587 | 4.26% | 10.83% | 10.76% |
| BURGOS | 4 | 3 | -25.00% | 0.08% | 0.06% |
| CACRES | 2 | 1 | -50,00% | 0.04% | 0.02% |
| CADIZ | 222 | 235 | 5.86% | 4.27% | 4.31% |
| CANTABRIA | 77 | 58 | -24.68% | 1.48% | 1.06% |
| CASTELLON | 54 | 56 | 3.70% | 1.04% | 1.03% |
| CEUTA | 16 | 17 | 6.25% | 0.31% | 0.31% |
| REAL CITY | 2 | 2 | 0,00% | 0.04% | 0.04% |
| CORDOBA | 24 | 18 | -25.00% | 0.46% | 0.33% |
| QUENCA | 0 | 3 | 0,00% | 0.06% | |
| GIRONA | 375 | 329 | -12.27% | 7.21% | 6.03% |
| GRANADA | 101 | 79 | -21.78% | 1.94% | 1.45% |
| GUADALAJARA | 3 | 6 | 100,00% | 0.06% | 0.11% |
| GUIPUZCOA | 46 | 35 | -23.91% | 0.88% | 0.64% |
| BELVA | 136 | 130 | -4.41% | 2.62% | 2.38% |
| BESCA | 1 | 3 | 200.00% | 0.02% | 0.06% |
| BALEAR ISLANDS | 1.003 | 984 | -1.89% | 19.29% | 18.05% |
| JAEN | 7 | 9 | 28.57% | 0.13% | 0.17% |
| THE RIOJA | 12 | 8 | -33.33% | 0.23% | 0.15% |
| THE PALMAS | 122 | 235 | 92.62% | 2.35% | 4.31% |
| LEON | 16 | 8 | -50,00% | 0.31% | 0.15% |
| LLEIDA | 10 | 10 | 0,00% | 0.19% | 0.18% |
| LIGHT | 11 | 18 | 63.64% | 0.21% | 0.33% |
| MADRID | 352 | 397 | 12.78% | 6.77% | 7.28% |
| MALAGA | 280 | 335 | 19.64% | 5.38% | 6.14% |
| MELILLA | 21 | 15 | -28.57% | 0.40% | 0.28% |
| MURCIA | 235 | 274 | 16.60% | 4.52% | 5.02% |
| NAVARRA | 11 | 13 | 18.18% | 0.21% | 0.24% |
| OURENSE | 6 | 7 | 16.67% | 0.12% | 0.13% |
| PALENCY | 0 | 3 | 0,00% | 0.06% | |
| PONTEVEDRA | 155 | 128 | -17.42% | 2.98% | 2.35% |
| SALAMANCA | 2 | 2 | 0,00% | 0.04% | 0.04% |
| _ | 109 | 175 | 60.55% | 2.10% | 3.21% |
| SEGOVIA | 1 | 1 | 0,00% | 0.02% | 0.02% |
| _ | 102 | 141 | 38.24% | 1.96% | 2.59% |
| SORIA | 1 | 0 | -100,00% | 0.02% | 0,00% |
| TARRAGONA | 115 | 133 | 15.65% | 2.21% | 2.44% |
| TERUEL | 1 | 3 | 200.00% | 0.02% | 0.06% |
| TOLEDO | 8 | 8 | 0,00% | 0.15% | 0.15% |
| VALENCE | 169 | 160 | -5.33% | 3.25% | 2.93% |
| VALLADOLID | 6 | 4 | -33.33% | 0.12% | 0.07% |
| VIZCAYA | 88 | 90 | 2.27% | 1.69% | 1.65% |
| ZAMORA | 3 | 3 | 0,00% | 0.06% | 0.06% |
| ZARAGOZA | 22 | 15 | -31.82% | 0.42% | 0.28% |
| Total | 5200 | 5453 | 4.9% | 100.0% | 100.0% |
© 2024 Nautica Digital Europe - www.nauticadigital.eu


