


Demand for smaller boats and water bikes continues to grow
Demand for smaller boats and water bikes continues to grow
The nautical market has 5,191 registered
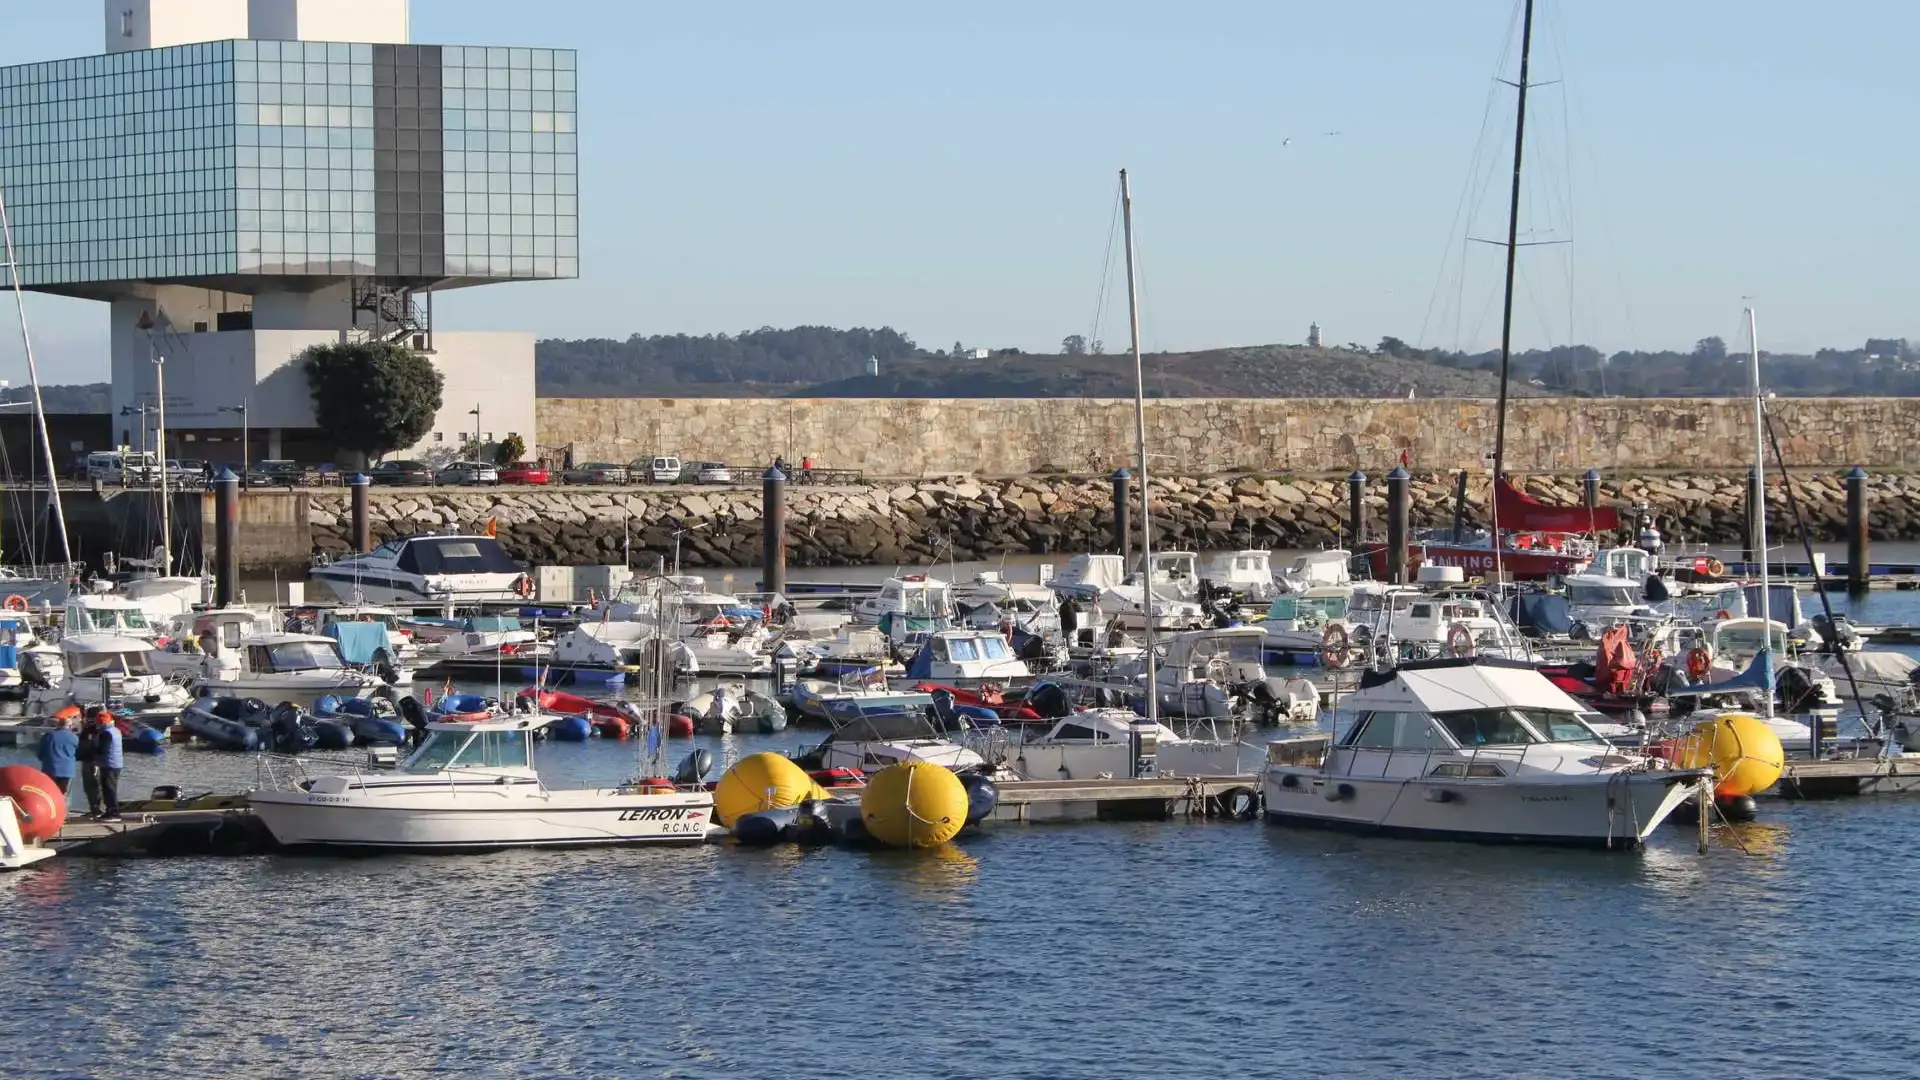
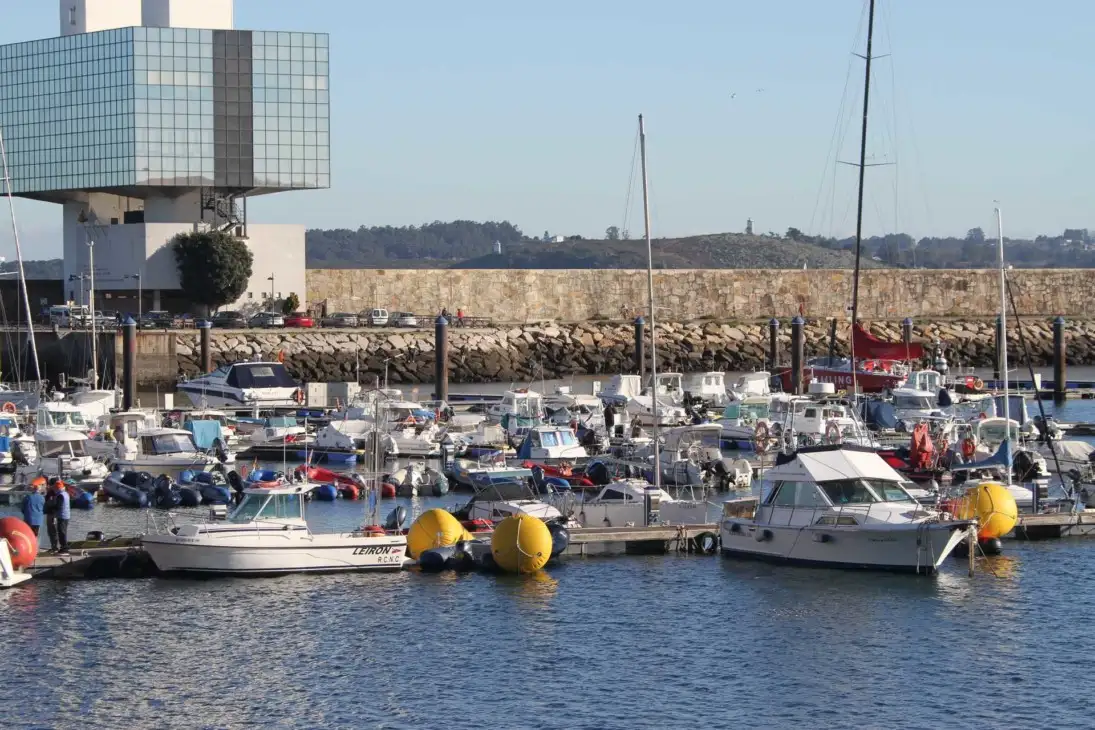
(Photo Pedro Seoane)
The registration of recreational craft in Spain reached 5,191 records until the end of August, 266 more than in the same period of 2022. This growth corresponds to the demand for vessels less than 6 metres long, mainly water bikes and folding pneumatic vessels.
In the nautical charter market there were until August 1,903 registration of vessels for this use, 9% more than in the same period of 2022... of the total registration, 63.3% (3,288) are for privately used vessels and 36.7% (1,903) for vessels for rent.
These are the data collected in the "Report of the market for recreational craft. Enero- August 2023," edited by ANEN from the data provided by the General Directorate of the Merchant Navy:
The smaller length, up to 6 meters, concentrates the growth of the nautical market in the year, with an increase in enrolment of 13.6%, and a market share of 72.5%.
| Length | 2021 | 2022 | 2023 | % ^ 21 | % ^ 22 | % 21 / Tot. | % 22 / Tot. | % 23 / Tot. |
| Up to 6 m | 4.169 | 3.312 | 3,761 | -9.8% | 13.6% | 70,1% | 67.2% | 72.5% |
| 6 to 8 m | 1,021 | 985 | 888 | -13.0% | -9.8% | 17.2% | 20.0% | 17.1% |
| 8 to 12 m | 517 | 432 | 366 | -29.2% | -15.3% | 8.7% | 8.8% | 7.1% |
| 12 to 16 m | 181 | 140 | 137 | -24.3% | -2.1% | 3.0% | 2.8% | 2.6% |
| More than 16 m | 55 | 56 | 39 | -29.1% | -30.4% | 0.9% | 1.1% | 0.8% |
| Total | 5,943 | 4,925 | 5.191 | -12.7% | 5.4% | 100.0% | 100.0% | 100.0% |
Water motorcycles (+ 71%) and folding pneumatic vessels (+ 31.5%) are the two markets with increased enrolment in the period under review. The motor, semi-rigid pneumatic and sailing boats are kept in negative.
| Market | 2021 | 2022 | 2023 | % ^ 21 | % ^ 22 | % 21 / Tot. | % 22 / Tot. | % 23 / Tot. |
| METHODS OF WATER | 1,654 | 1,045 | 1,789 | 8.2% | 71.2% | 27.8% | 21.2% | 34.5% |
| BLOOD TO MOTOR | 2,640 | 2.373 | 1,961 | -25.7% | -17.4% | 44.4% | 48.2% | 37.8% |
| NEUMATIS | 525 | 463 | 609 | 16.0% | 31.5% | 8.8% | 9.4% | 11.7% |
| SEMIRRIGID NEUMATIS | 689 | 668 | 550 | -20.2% | -17.7% | 11.6% | 13.6% | 10.6% |
| VELA | 435 | 376 | 282 | -35.2% | -25.0% | 7.3% | 7.6% | 5.4% |
| Total | 5,943 | 4,925 | 5.191 | -12.7% | 5.4% | 100.0% | 100.0% | 100.0% |
By provinceAmong those with the greatest impact on the nautical market, the growth of boat registration by residents in Madrid, 16% more than in the same period last year, and a market share of 7.40%, is highlighted.
In Catalonia, whose market share is 19.6% until the end of August, only Barcelona increases enrolment (+ 3.13%).
The Balearic Islands, the second autonomous community with the greatest impact on the nautical market (18%), has a fall between January and August of -2.6%.
Enrollment of recreational craft by province - August 2023
| Province | 2022 | 2023 | % ^ 22 | % 22 / Tot. | % 23 / Tot. |
| A CORUÑA | 132 | 130 | -1.52% | 2.68% | 2.50% |
| ALAVA | 7 | 3 | -57.14% | 0.14% | 0.06% |
| ALBACETE | 8 | 6 | -25.00% | 0.16% | 0.12% |
| ALICANTE | 312 | 310 | -0.64% | 6.34% | 5.97% |
| ALMERIA | 151 | 168 | 11.26% | 3.07% | 3.24% |
| ASTURIES | 47 | 40 | -14.89% | 0.95% | 0.77% |
| AVILA | 0 | 4 | 0,00% | 0.08% | |
| BADAJOZ | 13 | 17 | 30.77% | 0.26% | 0.33% |
| BARCELONA | 543 | 560 | 3.13% | 11.03% | 10.79% |
| BURGOS | 4 | 2 | -50,00% | 0.08% | 0.04% |
| CACRES | 2 | 1 | -50,00% | 0.04% | 0.02% |
| CADIZ | 211 | 217 | 2.84% | 4.28% | 4.18% |
| CANTABRIA | 71 | 56 | -21.13% | 1.44% | 1.08% |
| CASTELLON | 52 | 56 | 7.69% | 1.06% | 1.08% |
| CEUTA | 15 | 16 | 6.67% | 0.30% | 0.31% |
| REAL CITY | 2 | 2 | 0,00% | 0.04% | 0.04% |
| CORDOBA | 23 | 18 | -21.74% | 0.47% | 0.35% |
| QUENCA | 0 | 3 | 0,00% | 0.06% | |
| GIRONA | 360 | 317 | -11.94% | 7.31% | 6.11% |
| GRANADA | 100 | 76 | -24.00% | 2.03% | 1.46% |
| GUADALAJARA | 2 | 6 | 200.00% | 0.04% | 0.12% |
| GUIPUZCOA | 46 | 35 | -23.91% | 0.93% | 0.67% |
| BELVA | 126 | 128 | 1.59% | 2.56% | 2.47% |
| BESCA | 0 | 3 | 0,00% | 0.06% | |
| BALEAR ISLANDS | 958 | 933 | -2.61% | 19.45% | 17.97% |
| JAEN | 7 | 9 | 28.57% | 0.14% | 0.17% |
| THE RIOJA | 11 | 7 | -36.36% | 0.22% | 0.13% |
| THE PALMAS | 109 | 216 | 98.17% | 2.21% | 4.16% |
| LEON | 16 | 8 | -50,00% | 0.32% | 0.15% |
| LLEIDA | 10 | 10 | 0,00% | 0.20% | 0.19% |
| LIGHT | 11 | 18 | 63.64% | 0.22% | 0.35% |
| MADRID | 331 | 384 | 16.01% | 6.72% | 7.40% |
| MALAGA | 260 | 310 | 19.23% | 5.28% | 5.97% |
| MELILLA | 21 | 15 | -28.57% | 0.43% | 0.29% |
| MURCIA | 218 | 260 | 19.27% | 4.43% | 5.01% |
| NAVARRA | 11 | 13 | 18.18% | 0.22% | 0.25% |
| OURENSE | 6 | 7 | 16.67% | 0.12% | 0.13% |
| PALENCY | 0 | 3 | 0,00% | 0.06% | |
| PONTEVEDRA | 146 | 121 | -17.12% | 2.96% | 2.33% |
| SALAMANCA | 2 | 2 | 0,00% | 0.04% | 0.04% |
| _ | 96 | 165 | 71.88% | 1.95% | 3.18% |
| SEGOVIA | 1 | 1 | 0,00% | 0.02% | 0.02% |
| _ | 97 | 136 | 40.21% | 1.97% | 2.62% |
| SORIA | 1 | 0 | -100,00% | 0.02% | 0,00% |
| TARRAGONA | 105 | 131 | 24.76% | 2.13% | 2.52% |
| TERUEL | 1 | 3 | 200.00% | 0.02% | 0.06% |
| TOLEDO | 8 | 8 | 0,00% | 0.16% | 0.15% |
| VALENCE | 156 | 150 | -3.85% | 3.17% | 2.89% |
| VALLADOLID | 6 | 4 | -33.33% | 0.12% | 0.08% |
| VIZCAYA | 85 | 87 | 2.35% | 1.73% | 1.68% |
| ZAMORA | 3 | 2 | -33.33% | 0.06% | 0.04% |
| ZARAGOZA | 22 | 14 | -36.36% | 0.45% | 0.27% |
| Total | 4925 | 5191 | 5.4% | 100.0% | 100.0% |
© 2024 Nautica Digital Europe - www.nauticadigital.eu


