


ANEN report 1315 recreational ships registered in the first quarter
ANEN report 1315 recreational ships registered in the first quarter
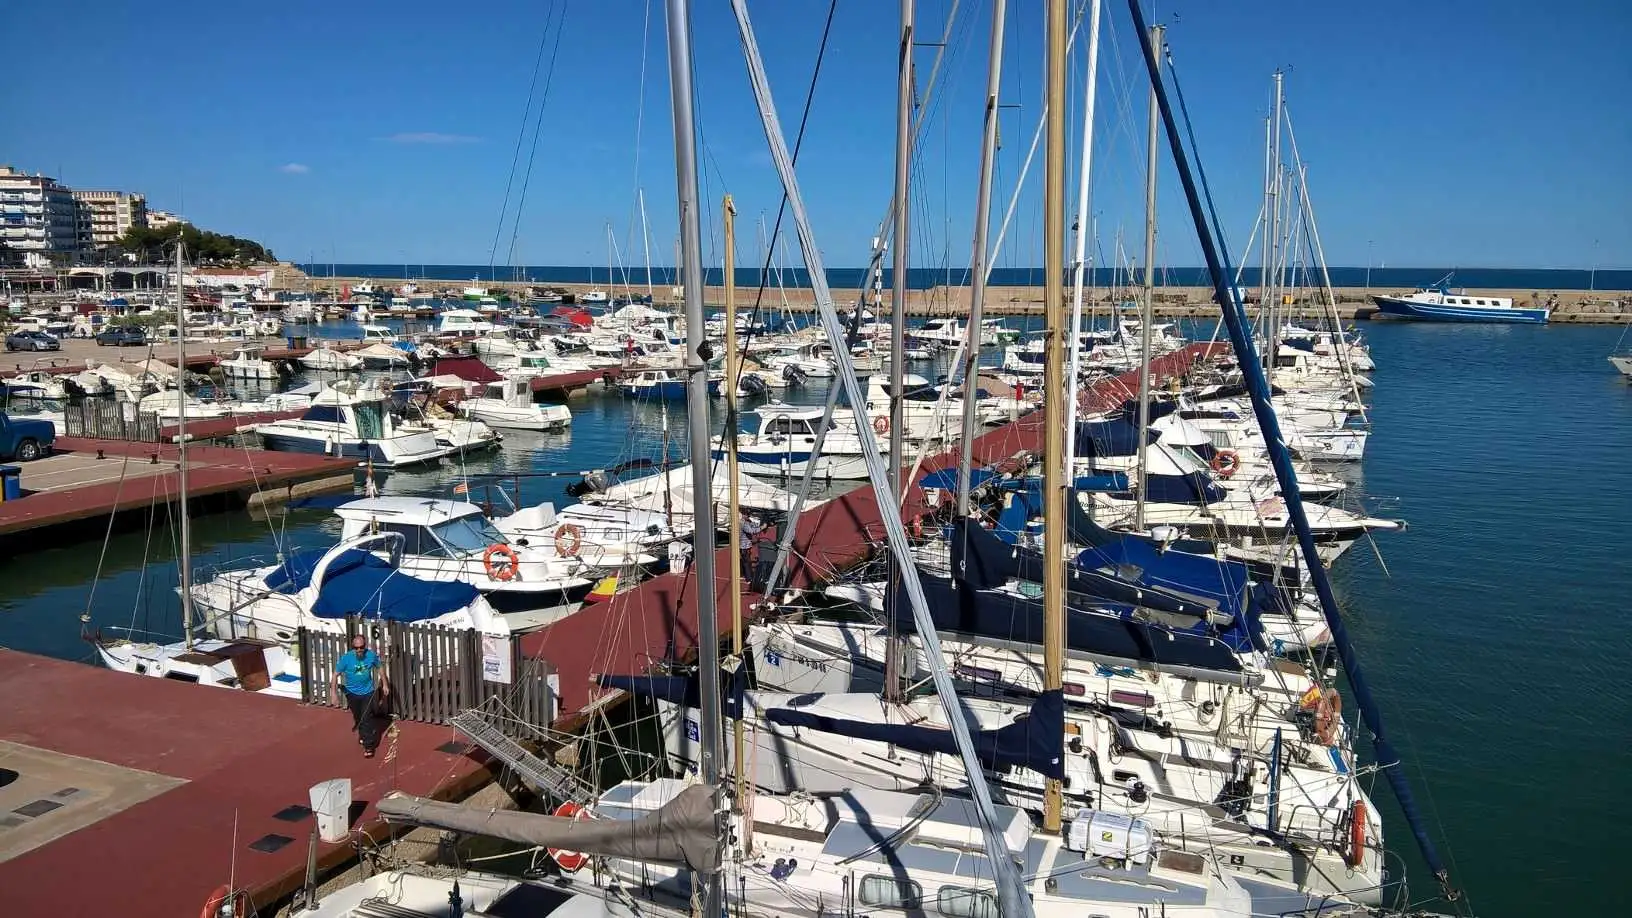
These are the data collected in the Recreation Boat Market Report. Enero- March 2023, edited by ANEN from the data provided by the General Directorate of the Merchant Navy (Photo Pedro Seoane)
The nautical market records up data in the first quarter of the year, anticipating the nautical season, with 1,315 registration of recreational boats.
Of the total number of vessels registered until March of this year, 850 (65%) are from ships for private use and 465 (35%) are from ships for the nautical charter that continues to grow to a greater extent (35%) than the global market.
These are the data collected in the"Recreation boat market report. Enero- March 2023", edited by ANEN on the basis of the data provided by the General Directorate of the Merchant Navy.
NATIONAL NATIC MARKET DATA
By length
The segment of smaller vessels, up to 6 meters, is the one that pulls out of the market with an increase in enrolment (25.6%) over the same period of 2022. The rest of the length is down during the period under review.
| Length | 2021 | 2022 | 2023 | % ^ 21 | % ^ 22 | % 21 / Tot. | % 22 / Tot. | % 23 / Tot. |
| - 6 m | 872 | 772 | 970 | 11.2% | 25.6% | 67.8% | 66.1% | 73.8% |
| 6-8 m | 224 | 232 | 210 | -6.3% | -9.5% | 17.4% | 19.9% | 16.0% |
| 8-12 m | 129 | 118 | 97 | -24.8% | -17.8% | 10.0% | 10.1% | 7.4% |
| 12-16 m | 44 | 32 | 30 | -31.8% | -6.3% | 3.4% | 2.7% | 2.3% |
| + 16 m | 17 | 14 | 8 | -52.9% | -42.9% | 1.3% | 1.2% | 0.6% |
| Total | 1.286 | 1.168 | 1,315 | 2.3% | 12.6% | 100.0% | 100.0% | 100.0% |
By type of vessel
The folding pneumatic vessels (+ 50.5%), water motorcycles (+ 42.9%) and motor vessels (+ 4.5%) are the ones with positive results, while the rest of the markets lose registration over the same period of 2022, with the most impact on the market of sailboats (-39.4%).
| Market | 2021 | 2022 | 2023 | % ^ 21 | % ^ 22 | % 21 / Tot. | % 22 / Tot. | % 23 / Tot. |
| Motor water | 379 | 289 | 413 | 9.0% | 42.9% | 29.5% | 24.7% | 31.4% |
| Motor boats | 549 | 512 | 535 | -2.6% | 4.5% | 42.7% | 43.8% | 40.7% |
| Pneumatic P | 109 | 107 | 161 | 47.7% | 50.5% | 8.5% | 9.2% | 12.2% |
| Pneumatic S | 125 | 128 | 126 | 0.8% | -1.6% | 9.7% | 11.0% | 9.6% |
| Sailboats | 124 | 132 | 80 | -35.5% | -39.4% | 9.6% | 11.3% | 6.1% |
| Total | 1.286 | 1.168 | 1,315 | 2.3% | 12.6% | 100.0% | 100.0% | 100.0% |
Enrolment by province
In the first two months of 2023, Andalusia (21%), followed by the Balearic Islands (17.87%) and Catalonia (17.64%) are the Autonomous Communities with the highest market share. The following are the Valencia Community (11.70%) and the Canary Islands (11%).
In the charter market,the Balearic Islands continue to lead this market with 30.11% share, followed by Catalonia (21.43%) and the Valencia Community (12.91%).
Enrolment of recreational boats by province. January - March 2023
Source: ANEN with DGMM data
| Province | 2022 | 2023 | % ^ 22 | % 22 / Tot. | % 23 / Tot. |
| A CORUÑA | 41 | 35 | -14.63% | 3.51% | 2.66% |
| ALAVA | 2 | 1 | -50,00% | 0.17% | 0.08% |
| ALBACETE | 2 | 0 | -100,00% | 0.17% | 0,00% |
| ALICANTE | 88 | 91 | 3.41% | 7.53% | 6.92% |
| ALMERIA | 39 | 35 | -10.26% | 3.34% | 2.66% |
| ASTURIES | 14 | 10 | -28.57% | 1.20% | 0.76% |
| AVILA | 0 | 2 | 0,00% | 0.15% | |
| BADAJOZ | 3 | 5 | 66.67% | 0.26% | 0.38% |
| BARCELONA | 115 | 143 | 24.35% | 9.85% | 10.87% |
| BURGOS | 0 | 0 | 0,00% | 0,00% | |
| CACRES | 0 | 0 | 0,00% | 0,00% | |
| CADIZ | 53 | 58 | 9.43% | 4.54% | 4.41% |
| CANTABRIA | 12 | 12 | 0,00% | 1.03% | 0.91% |
| CASTELLON | 23 | 13 | -43.48% | 1.97% | 0.99% |
| CEUTA | 3 | 2 | -33.33% | 0.26% | 0.15% |
| REAL CITY | 1 | 1 | 0,00% | 0.09% | 0.08% |
| CORDOBA | 9 | 6 | -33.33% | 0.77% | 0.46% |
| GIRONA | 53 | 53 | 0,00% | 4.54% | 4.03% |
| GRANADA | 25 | 16 | -36.00% | 2.14% | 1.22% |
| GUADALAJARA | 1 | 3 | 200.00% | 0.09% | 0.23% |
| GUIPUZCOA | 12 | 10 | -16.67% | 1.03% | 0.76% |
| BELVA | 25 | 39 | 56.00% | 2.14% | 2.97% |
| BESCA | 0 | 0 | 0,00% | 0,00% | |
| BALEAR ISLANDS | 189 | 235 | 24.34% | 16.18% | 17.87% |
| JAEN | 2 | 4 | 100,00% | 0.17% | 0.30% |
| THE RIOJA | 7 | 1 | -85.71% | 0.60% | 0.08% |
| THE PALMAS | 40 | 77 | 92.50% | 3.42% | 5.86% |
| LEON | 0 | 3 | 0,00% | 0.23% | |
| LLEIDA | 3 | 1 | -66.67% | 0.26% | 0.08% |
| LIGHT | 1 | 5 | 400,00% | 0.09% | 0.38% |
| MADRID | 74 | 81 | 9.46% | 6.34% | 6.16% |
| MALAGA | 84 | 73 | -13.10% | 7.19% | 5.55% |
| MELILLA | 4 | 2 | -50,00% | 0.34% | 0.15% |
| MURCIA | 51 | 61 | 19.61% | 4.37% | 4.64% |
| NAVARRA | 3 | 4 | 33.33% | 0.26% | 0.30% |
| OURENSE | 1 | 1 | 0,00% | 0.09% | 0.08% |
| PALENCY | 0 | 1 | 0,00% | 0.08% | |
| PONTEVEDRA | 47 | 33 | -29.79% | 4.02% | 2.51% |
| SALAMANCA | 0 | 1 | 0,00% | 0.08% | |
| SC TENERIFE | 24 | 43 | 79.17% | 2.05% | 3.27% |
| SEGOVIA | 0 | 0 | 0,00% | 0,00% | |
| _ | 20 | 45 | 125.00% | 1.71% | 3.42% |
| TARRAGONA | 30 | 35 | 16.67% | 2.57% | 2.66% |
| TERUEL | 0 | 1 | 0,00% | 0.08% | |
| TOLEDO | 1 | 3 | 200.00% | 0.09% | 0.23% |
| VALENCE | 36 | 45 | 25.00% | 3.08% | 3.42% |
| VALLADOLID | 1 | 0 | -100,00% | 0.09% | 0,00% |
| VIZCAYA | 24 | 22 | -8.33% | 2.05% | 1.67% |
| ZAMORA | 1 | 1 | 0,00% | 0.09% | 0.08% |
| ZARAGOZA | 4 | 2 | -50,00% | 0.34% | 0.15% |
| Total | 1168 | 1315 | 12.6% | 100.0% | 100.0% |
© 2024 Nautica Digital Europe - www.nauticadigital.eu


