264 new enrolments in january the best data for the last 3 years
264 new enrolments in january the best data for the last 3 years
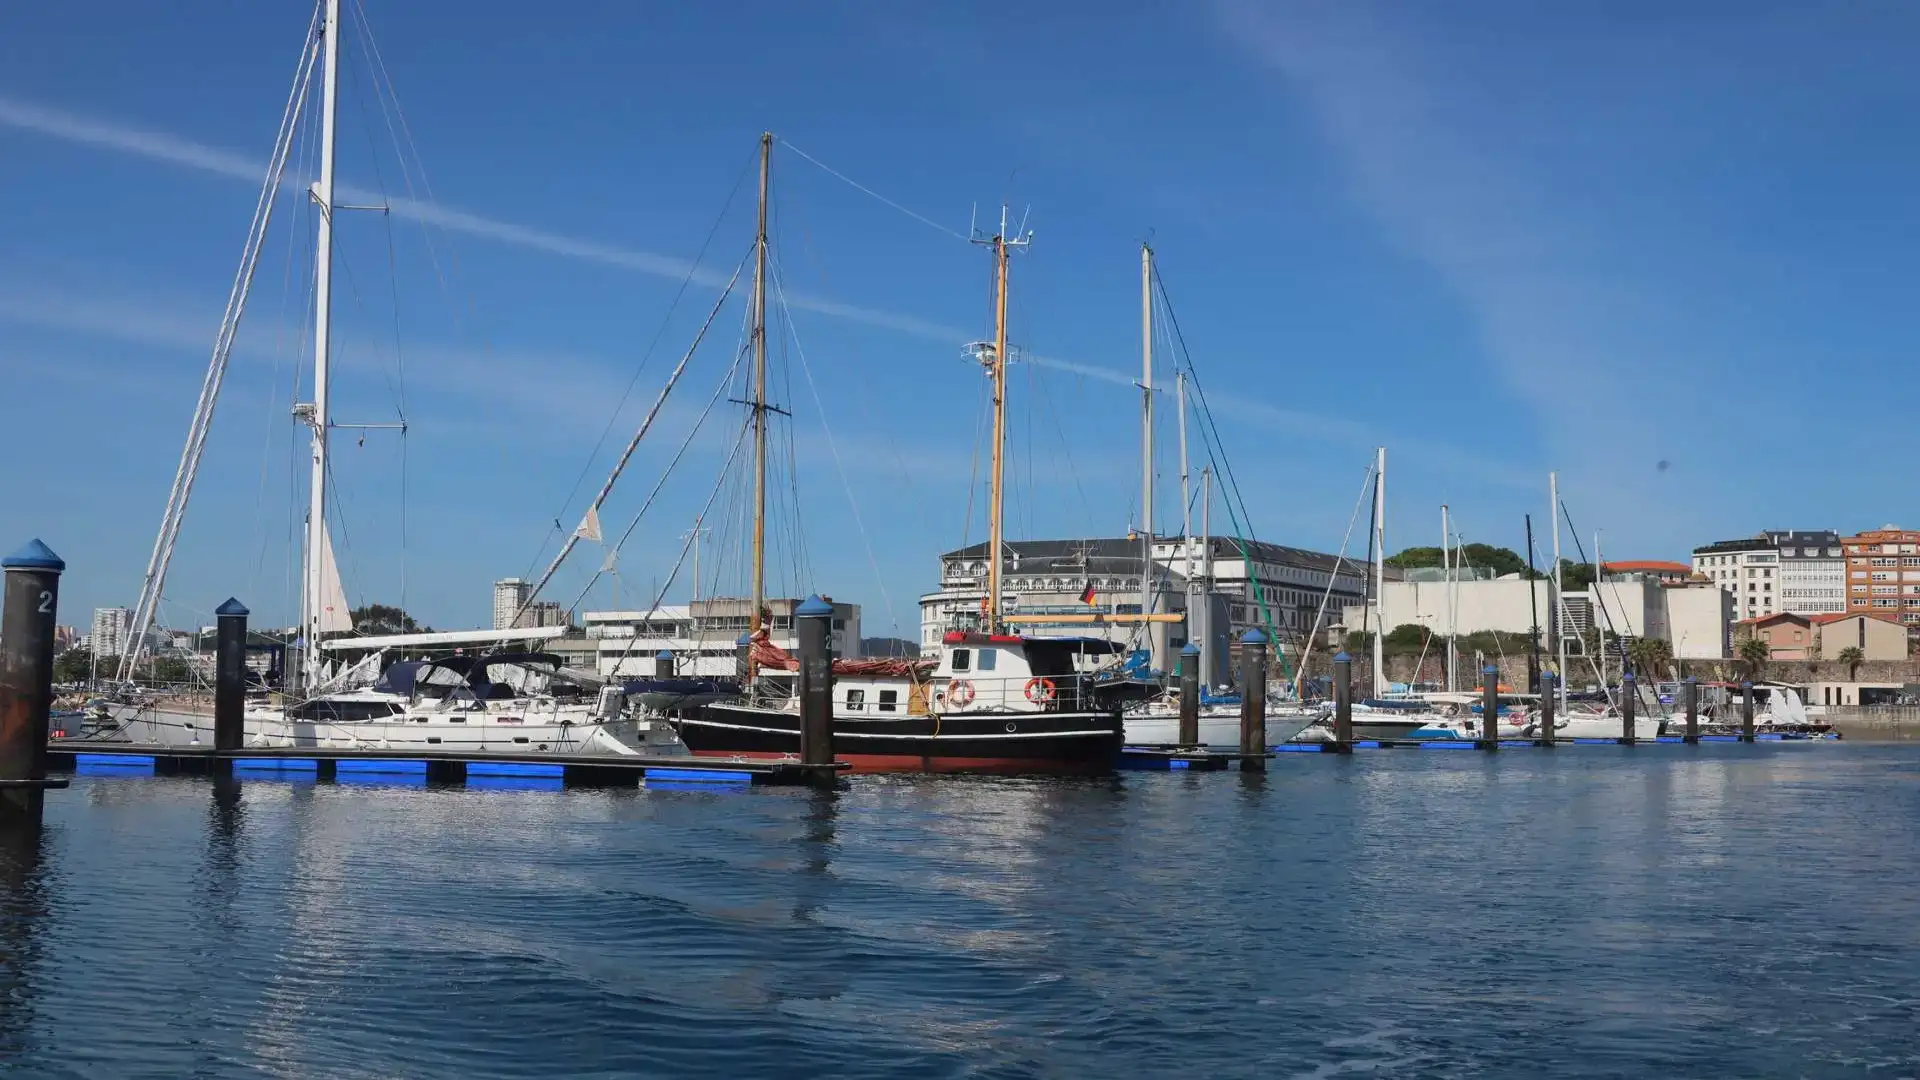
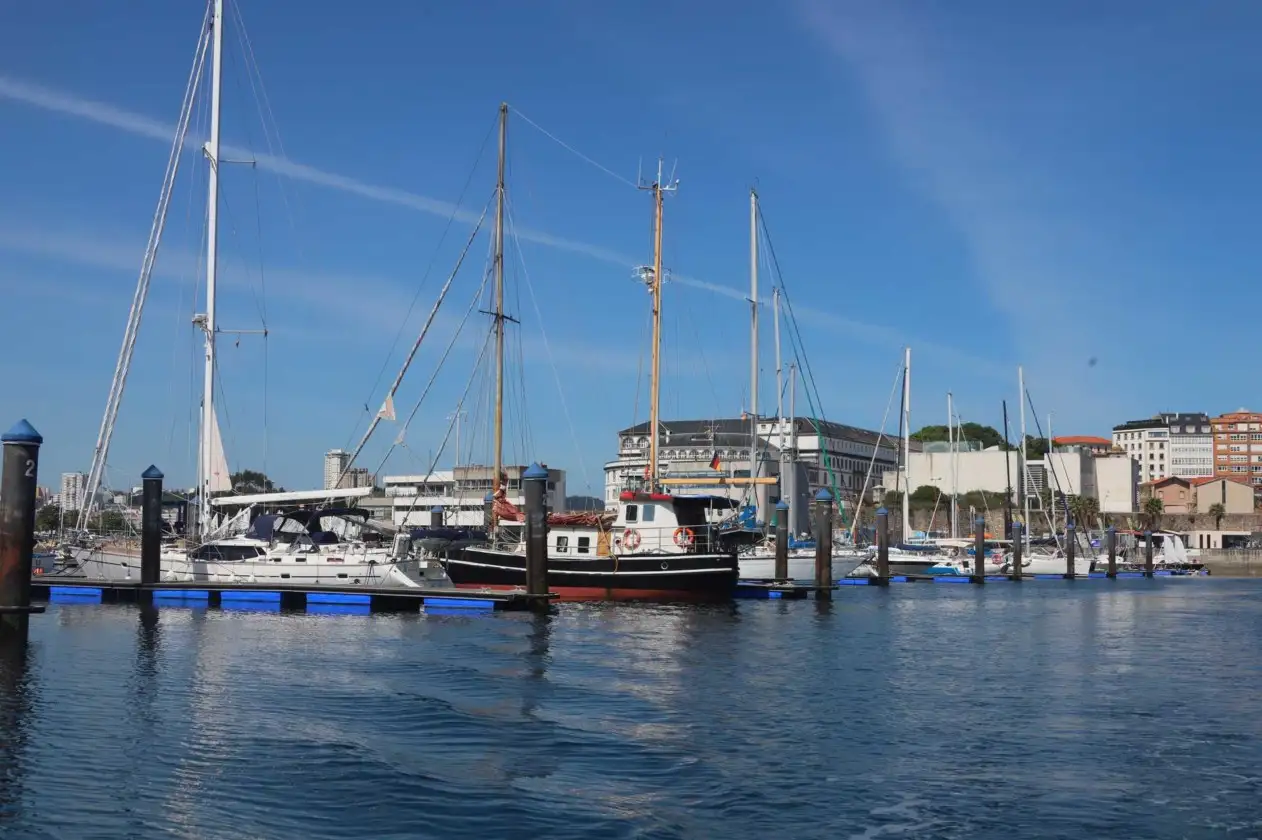
The nautical market has closed the month of January with 264 registration of recreational boats, which is a 40% increase over the month of January 2022. This is the best data on the nautical market in the last 3 years.
Of the total number of vessels registered in January 2023, 73% are for private-use vessels and 27% for vessels intended for the nautical charter, the latter being the market with the highest growth, with 71 records compared to 39 in January 2022.
These are the data collected in the Report on the market for recreational craft. January 2023, edited by ANEN on the basis of the data provided by the General Directorate of the Merchant Navy.
By length
The smaller segment of vessels, up to 6 metres, shows the largest increase in enrolment (82.5%) compared with January 2022. Also vessels over 16 meters of age have good behavior. The average length, between 8 and 12 meters, has a decrease of -28%.
| Length | 2021 | 2022 | 2023 | % ^ 21 | % ^ 22 | % 21 / Tot. | % 22 / Tot. | % 23 / Tot. |
| Up to 6 m | 127 | 114 | 208 | 63.8% | 82.5% | 68.3% | 60.6% | 78.8% |
| 6 to 8 m | 34 | 43 | 33 | -2.9% | -23.3% | 18.3% | 22.9% | 12.5% |
| 8 to 12 m | 15 | 23 | 15 | 0.0% | -34.8% | 8.1% | 12.2% | 5.7% |
| 12 to 16 m | 8 | 7 | 5 | -37.5% | -28.6% | 4.3% | 3.7% | 1.9% |
| More than 16 m | 2 | 1 | 3 | 50.0% | 2000.0% | 1.1% | 0.5% | 1.1% |
| Total | 186 | 188 | 264 | 41.9% | 40.4% | 100.0% | 100.0% | 100.0% |
They remove the water bikes, much affected by the supply crisis, which reach 85 enrolments compared to 23 last year. Also the folding pneumatic vessels repoint, doubling the records made in January last year. The motor ships, with a growth of 6,6%, are kept in positive.
Semi-rigid pneumatic vessels and sailboats are the markets that experience falls of 11.5% and 34.6%, respectively.
| Market | 2021 | 2022 | 2023 | % ^ 21 | % ^ 22 | % 21 / Tot. | % 22 / Tot. | % 23 / Tot. |
| METHODS OF WATER | 34 | 23 | 85 | 150.0% | 269.6% | 18.3% | 12.2% | 32.2% |
| BLOOD TO MOTOR | 90 | 91 | 97 | 7.8% | 6.6% | 48.4% | 48.4% | 36.7% |
| NEUMATIS | 25 | 22 | 42 | 68.0% | 90.9% | 13.4% | 11.7% | 15.9% |
| SEMIRRIGID NEUMATIS | 16 | 26 | 23 | 43.8% | -11.5% | 8.6% | 13.8% | 8.7% |
| VELA | 21 | 26 | 17 | -19.0% | -34.6% | 11.3% | 13.8% | 6.4% |
| Total | 186 | 188 | 264 | 41.9% | 40.4% | 100.0% | 100.0% | 100.0% |
In January of this year, Andalusia (18.84%) and the Canary Islands (16.26%) have been the Autonomous Communities with the highest market share, followed by the Valencia Community (14.39%), Catalonia (13.64%) and the Balearic Islands (11.36%).
In the charter market,The Canary Islands, with a share of 32.4%, lead the charter market in January of this year. Secondly, the Valencia Community, with a share of 24%, followed by the Balearic Islands with 19.72% of the market for rental of recreational boats.
Enrolment of recreational boats by province - January 2023
Source: ANEN with DGMM data
| Province | 2022 | 2023 | % ^ 22 | % 22 / Tot. | % 23 / Tot. |
| A CORUÑA | 6 | 7 | 16.67% | 3.19% | 2.65% |
| ALAVA | 2 | 0 | -100,00% | 1.06% | 0,00% |
| ALBACETE | 1 | 0 | -100,00% | 0.53% | 0,00% |
| ALICANTE | 15 | 21 | 40,00% | 7.98% | 7.95% |
| ALMERIA | 7 | 14 | 100,00% | 3.72% | 5.30% |
| ASTURIES | 1 | 2 | 100,00% | 0.53% | 0.76% |
| AVILA | 0 | 1 | 0,00% | 0.38% | |
| BADAJOZ | 0 | 2 | 0,00% | 0.76% | |
| BARCELONA | 21 | 30 | 42.86% | 11.17% | 11.36% |
| BURGOS | 0 | 0 | 0,00% | 0,00% | |
| CADIZ | 4 | 20 | 400,00% | 2.13% | 7.58% |
| CANTABRIA | 2 | 4 | 100,00% | 1.06% | 1.52% |
| CASTELLON | 1 | 3 | 200.00% | 0.53% | 1.14% |
| CEUTA | 1 | 0 | -100,00% | 0.53% | 0,00% |
| CORDOBA | 0 | 1 | 0,00% | 0.38% | |
| GIRONA | 4 | 3 | -25.00% | 2.13% | 1.14% |
| GRANADA | 2 | 2 | 0,00% | 1.06% | 0.76% |
| GUADALAJARA | 0 | 0 | 0,00% | 0,00% | |
| GUIPUZCOA | 1 | 2 | 100,00% | 0.53% | 0.76% |
| BELVA | 2 | 8 | 300,00% | 1.06% | 3.03% |
| BALEAR ISLANDS | 24 | 30 | 25.00% | 12.77% | 11.36% |
| JAEN | 1 | 1 | 0,00% | 0.53% | 0.38% |
| THE PALMAS | 11 | 32 | 190.91% | 5.85% | 12.12% |
| LLEIDA | 1 | 1 | 0,00% | 0.53% | 0.38% |
| LIGHT | 0 | 0 | 0,00% | 0,00% | |
| MADRID | 18 | 15 | -16.67% | 9.57% | 5.68% |
| MALAGA | 13 | 8 | -38.46% | 6.91% | 3.03% |
| MELILLA | 0 | 1 | 0,00% | 0.38% | |
| MURCIA | 10 | 11 | 10.00% | 5.32% | 4.17% |
| NAVARRA | 0 | 2 | 0,00% | 0.76% | |
| PONTEVEDRA | 5 | 8 | 60,00% | 2.66% | 3.03% |
| _ | 9 | 11 | 22.22% | 4.79% | 4.17% |
| _ | 4 | 4 | 0,00% | 2.13% | 1.52% |
| TARRAGONA | 3 | 2 | -33.33% | 1.60% | 0.76% |
| TERUEL | 0 | 1 | 0,00% | 0.38% | |
| VALENCE | 12 | 14 | 16.67% | 6.38% | 5.30% |
| VIZCAYA | 4 | 2 | -50,00% | 2.13% | 0.76% |
| ZARAGOZA | 3 | 1 | -66.67% | 1.60% | 0.38% |
| Total | 188 | 264 | 40.4% | 100.0% | 100.0% |
© 2024 Nautica Digital Europe - www.nauticadigital.eu


