


5847 new spanish registration in 2022 of ships
5847 new spanish registration in 2022 of ships

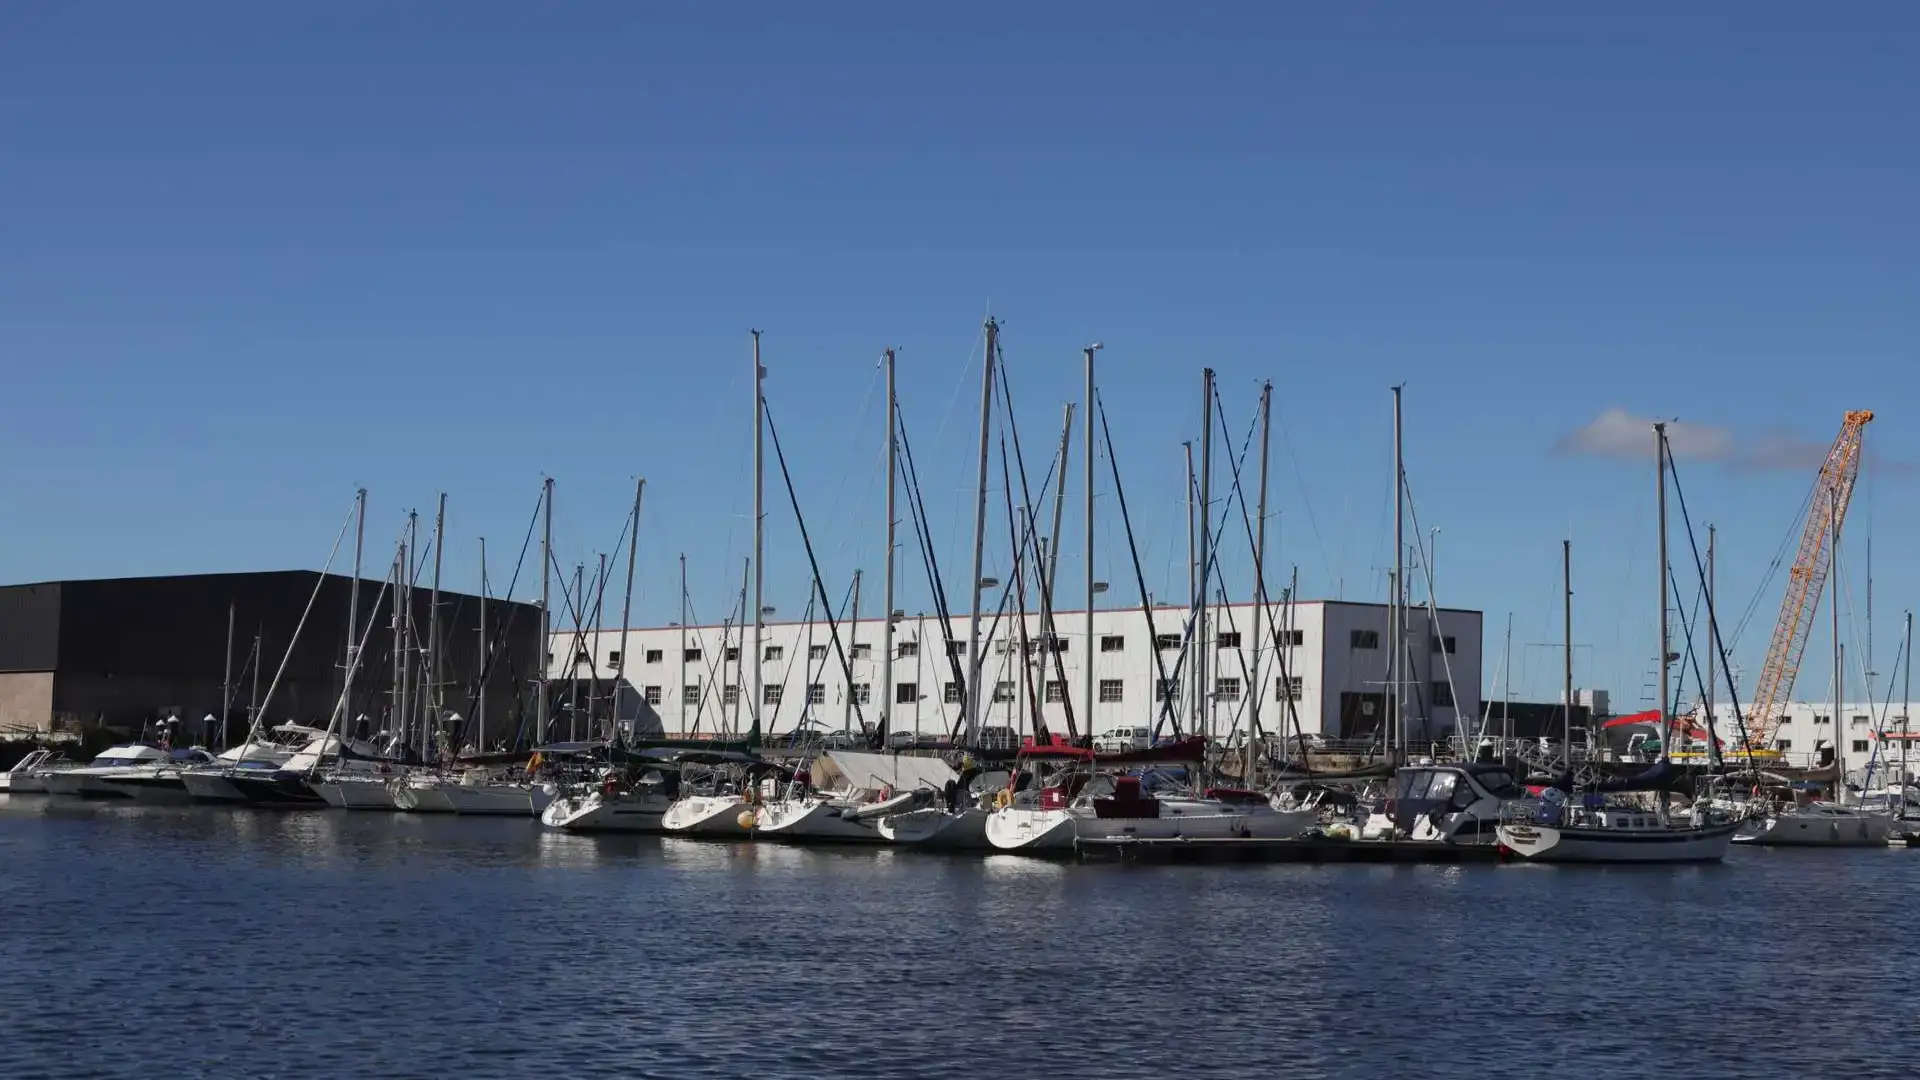
The nautical market closes 2022 with 5,847 enrollments, maintaining stability according to forecasts (Photo Pedro Seoane)
The annual registration data for vessels for the financial year 2022 is 5,847 records, -14.94% less than in 2021. These data meet the sector's 2022 forecasts, maintaining and significantly improving the stability of the national nautical market. The month of December, a month that has historically been recording the lowest enrolment figures of the year, has broken this trend in 2022 with a growth of 31% of enrolments compared to the same month last year.
The nautical charter market (rental of recreational boats) also improves the average figures for the exercise, with a growth in the registration of recreational boats for commercial use of 1.24% compared to 2021. The month of December has also been particularly positive for the nautical charter with a 125% increase in enrolment.
These are the data collected in the "Annual Report of the market for recreational craft 2022," edited by ANEN on the basis of the data provided by the General Directorate of the Merchant Navy.
NATIC MARKET DATA
By length
In the consolidated exercise, it is worth noting the good behaviour of the registration of ships over 16 meters that grow by 5.9%. The rest of the shelves fall, with the highest incidence in the segments of the average length, from 8 to 16 meters.
| Length | 2020 | 2021 | 2022 | % ^ 20 | % ^ 21 | % 20 / Tot. | % 21 / Tot. | % 22 / Tot. |
| Up to 6 m | 3,825 | 4,757 | 4,026 | 5.3% | -15.4% | 70.8% | 69.2% | 68.9% |
| 6 to 8 m | 948 | 1.193 | 1.106 | 16.7% | -7.3% | 17.5% | 17.4% | 18.9% |
| 8 to 12 m | 429 | 641 | 485 | 13.1% | -24.3% | 7.9% | 9.3% | 8.3% |
| 12 to 16 m | 147 | 215 | 158 | 7.5% | -26.5% | 2.7% | 3.1% | 2.7% |
| More than 16 m | 55 | 68 | 72 | 30.9% | 5.9% | 1.0% | 1.0% | 1.2% |
| Total | 5.404 | 6,874 | 5,847 | 8.2% | -14.9% | 100.0% | 100.0% | 100.0% |
By type of vessel,The water bikes have the greatest fall (-27%) following the trend of the year as they are most affected by the logistics crisis, followed by sailboats (-15,5%), motor ships (-12%), semi-rigid pneumatic vessels (-8,6%) and folding pneumatic vessels (-3%).
| Market | 2020 | 2021 | 2022 | % ^ 20 | % ^ 21 | % 20 / Tot. | % 21 / Tot. | % 22 / Tot. |
| METHODS OF WATER | 1,563 | 1,762 | 1,280 | -18.1% | -27.4% | 28.9% | 25.6% | 21.9% |
| BLOOD TO MOTOR | 2,194 | 3,074 | 2,704 | 23.2% | -12.0% | 40.6% | 44.7% | 46.2% |
| NEUMATIS | 633 | 667 | 647 | 2.2% | -3.0% | 11.7% | 9.7% | 11.1% |
| SEMIRRIGID NEUMATIS | 632 | 837 | 765 | 21.0% | -8.6% | 11.7% | 12.2% | 13.1% |
| VELA | 382 | 534 | 451 | 18.1% | -15.5% | 7.1% | 7.8% | 7.7% |
| Total | 5.404 | 6,874 | 5,847 | 8.2% | -14.9% | 100.0% | 100.0% | 100.0% |
Enrolment by province
In 2022, Catalonia and the Balearic Islands were the Autonomous Communities with the highest nautical activity, with market shares of 19.7% and 18.5%, respectively.
In the computation of enrolments, certain coastal territories in the north such as Guipúzcoa (+ 10.42%) and Cantabria (+ 9.46%), and Girona in Catalonia (+ 2.8%) have the best data on the increase in enrolments in 2022. It is also worth noting the growth of enrolment in interior provinces such as Álava, León, Valladolid and Burgos.
In the charter market,The Balearic Islands led this market in 2022 (31% share) and recorded a growth in charter registration of the coastal territories (28%). It is also worth noting the increase in the registration of boats for rent in Gran Canaria, Ceuta, Cadiz, Tenerife, Tarragona and Cantabria.
Enrolment by province 2022 (annual).
Source: ANEN with DGMM data
| Province | 2021 | 2022 | % ^ 21 | % 21 / Tot. | % 22 / Tot. |
| A CORUÑA | 169 | 167 | -1.18% | 2.46% | 2.86% |
| ALAVA | 3 | 8 | 166.67% | 0.04% | 0.14% |
| ALBACETE | 8 | 9 | 12.50% | 0.12% | 0.15% |
| ALICANTE | 513 | 361 | -29.63% | 7.46% | 6.17% |
| ALMERIA | 254 | 188 | -25.98% | 3.70% | 3.22% |
| ASTURIES | 85 | 57 | -32.94% | 1.24% | 0.97% |
| AVILA | 1 | 0 | -100,00% | 0.01% | 0,00% |
| BADAJOZ | 15 | 16 | 6.67% | 0.22% | 0.27% |
| BARCELONA | 712 | 608 | -14.61% | 10.36% | 10.40% |
| BURGOS | 3 | 5 | 66.67% | 0.04% | 0.09% |
| CACRES | 3 | 3 | 0,00% | 0.04% | 0.05% |
| CADIZ | 296 | 264 | -10.81% | 4.31% | 4.52% |
| CANTABRIA | 74 | 81 | 9.46% | 1.08% | 1.39% |
| CASTELLON | 89 | 56 | -37.08% | 1.29% | 0.96% |
| CEUTA | 42 | 17 | -59.52% | 0.61% | 0.29% |
| REAL CITY | 9 | 2 | -77.78% | 0.13% | 0.03% |
| CORDOBA | 37 | 27 | -27.03% | 0.54% | 0.46% |
| QUENCA | 2 | 0 | -100,00% | 0.03% | 0,00% |
| GIRONA | 392 | 403 | 2.81% | 5.70% | 6.89% |
| GRANADA | 127 | 116 | -8.66% | 1.85% | 1.98% |
| GUADALAJARA | 7 | 3 | -57.14% | 0.10% | 0.05% |
| GUIPUZCOA | 48 | 53 | 10.42% | 0.70% | 0.91% |
| BELVA | 256 | 157 | -38.67% | 3.72% | 2.69% |
| BESCA | 3 | 2 | -33.33% | 0.04% | 0.03% |
| BALEAR ISLANDS | 1.152 | 1,080 | -6.25% | 16.76% | 18.47% |
| JAEN | 6 | 7 | 16.67% | 0.09% | 0.12% |
| THE RIOJA | 9 | 12 | 33.33% | 0.13% | 0.21% |
| THE PALMAS | 167 | 169 | 1.20% | 2.43% | 2.89% |
| LEON | 7 | 17 | 142.86% | 0.10% | 0.29% |
| LLEIDA | 15 | 12 | -20.00% | 0.22% | 0.21% |
| LIGHT | 26 | 12 | -53.85% | 0.38% | 0.21% |
| MADRID | 428 | 386 | -9.81% | 6.23% | 6.60% |
| MALAGA | 364 | 319 | -12.36% | 5.30% | 5.46% |
| MELILLA | 36 | 22 | -38.89% | 0.52% | 0.38% |
| MURCIA | 304 | 268 | -11.84% | 4.42% | 4.58% |
| NAVARRA | 10 | 12 | 20.00% | 0.15% | 0.21% |
| OURENSE | 6 | 8 | 33.33% | 0.09% | 0.14% |
| PALENCY | 1 | 0 | -100,00% | 0.01% | 0,00% |
| PONTEVEDRA | 202 | 179 | -11.39% | 2.94% | 3.06% |
| SALAMANCA | 5 | 3 | -40,00% | 0.07% | 0.05% |
| _ | 195 | 150 | -23.08% | 2.84% | 2.57% |
| SEGOVIA | 2 | 2 | 0,00% | 0.03% | 0.03% |
| _ | 155 | 112 | -27.74% | 2.25% | 1.92% |
| SORIA | 4 | 1 | -75.00% | 0.06% | 0.02% |
| TARRAGONA | 133 | 128 | -3.76% | 1.93% | 2.19% |
| TERUEL | 1 | 1 | 0,00% | 0.01% | 0.02% |
| TOLEDO | 9 | 9 | 0,00% | 0.13% | 0.15% |
| VALENCE | 317 | 199 | -37.22% | 4.61% | 3.40% |
| VALLADOLID | 3 | 7 | 133.33% | 0.04% | 0.12% |
| VIZCAYA | 142 | 104 | -26.76% | 2.07% | 1.78% |
| ZAMORA | 2 | 3 | 50,00% | 0.03% | 0.05% |
| ZARAGOZA | 25 | 22 | -12.00% | 0.36% | 0.38% |
| Total | 6874 | 5847 | -14.9% | 100.0% | 100.0% |
© 2024 Nautica Digital Europe - www.nauticadigital.eu


