


The nautical remains stable until November with 5,640 enrolments
The nautical remains stable until November with 5,640 enrolments

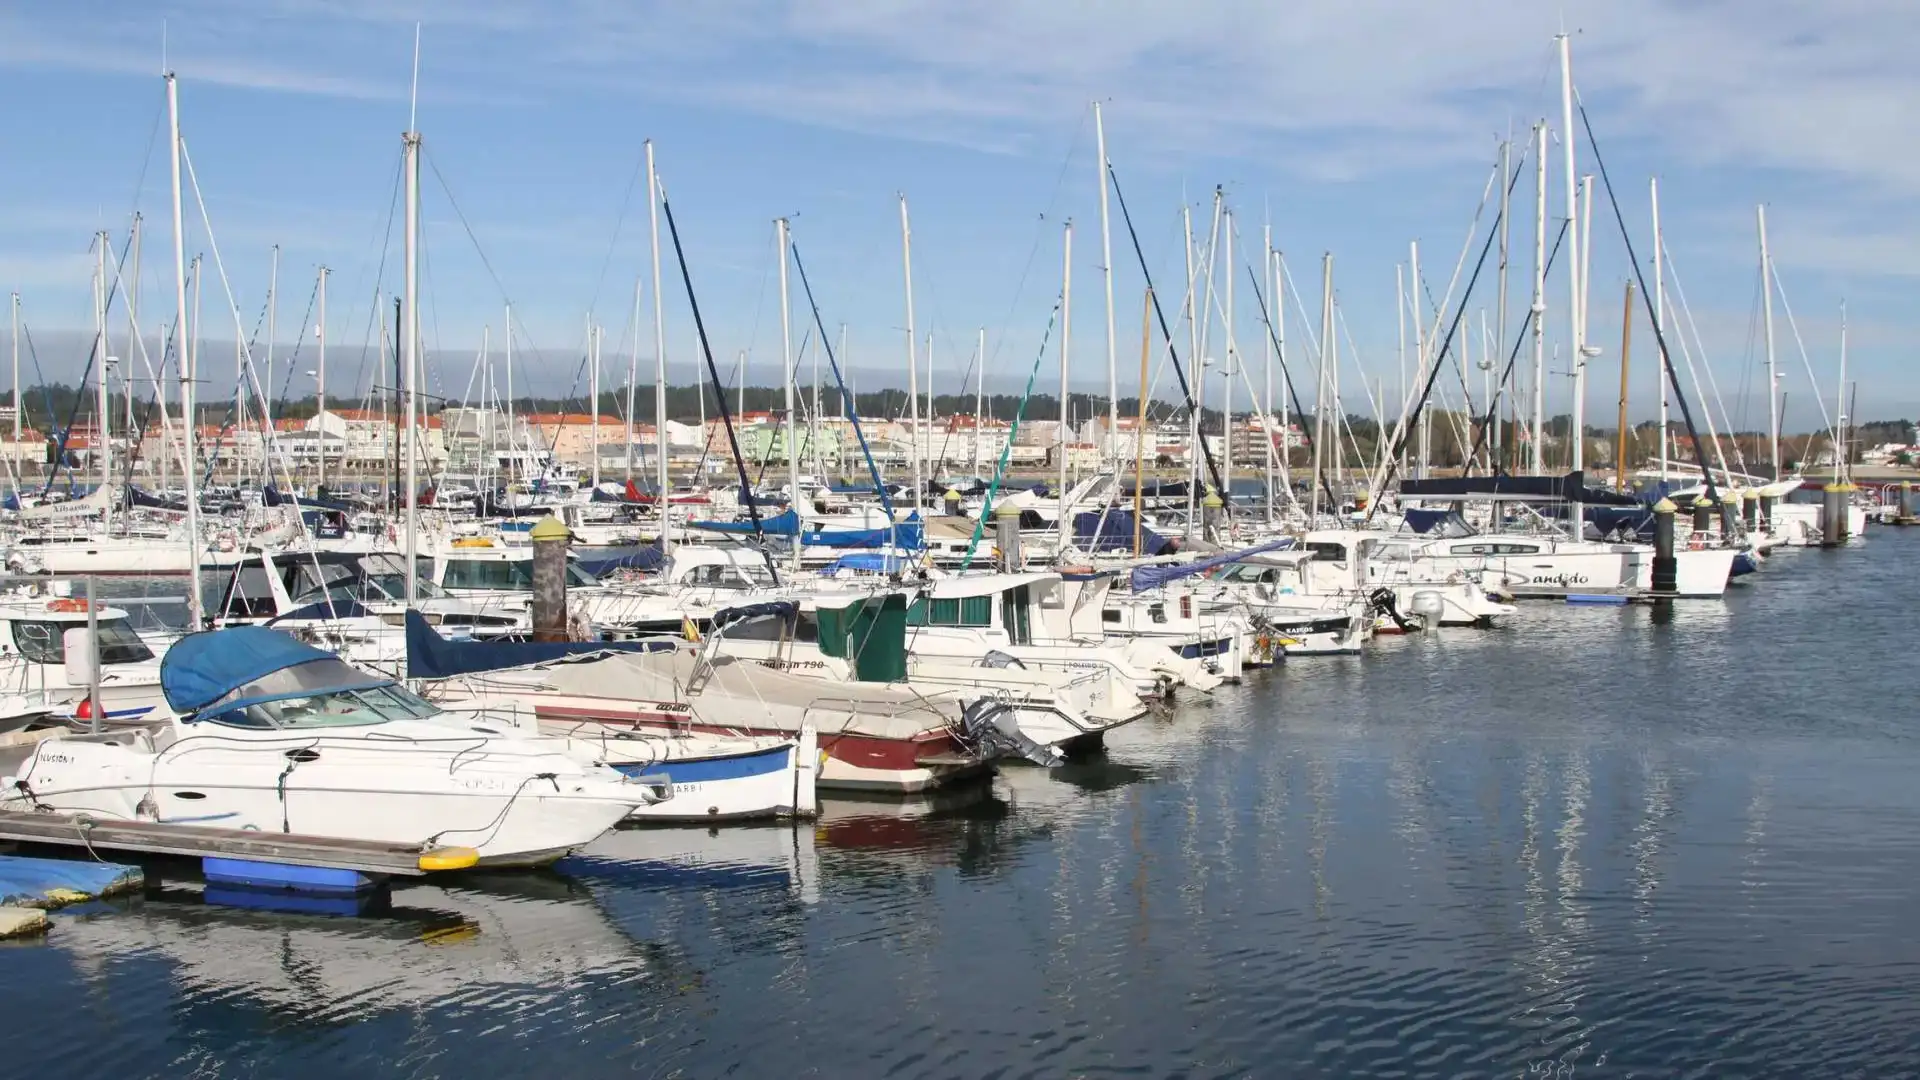
The nautical market maintains its turnover after a positive summer season, with the overall stability of the registration of recreational boats in recent months. We anticipate a closure of the exercise in similar figures, with fewer accused of registration in smaller segments of boats and water bikes, these are the markets most affected by the logistics crisis and international economic uncertainty (Photo Pedro Seoane)
The registration of recreational craft from January to November keeps the decrease of -16%, with a total of 5,640 records, compared with the same period of 2021. The charter market (rental of recreational boats) continues to improve its figures.
These are the data collected in the Report on the market for energy recreational craft - November, 2022, edited by ANEN on the basis of the data provided by the General Directorate of the Merchant Navy.
NATIC MARKET DATA
By length
In the period under review all length falls, with the exception of vessels over 16 metres increasing their enrolment by 1.5%.
| Length | 2020 | 2021 | 2022 | % ^ 20 | % ^ 21 | % 20 / Tot. | % 21 / Tot. | % 22 / Tot. |
| Up to 6 m | 3,697 | 4.666 | 3,878 | 4.9% | -16.9% | 71.1% | 69.5% | 68.8% |
| 6 to 8 m | 921 | 1.160 | 1,079 | 17.2% | -7.0% | 17.7% | 17.3% | 19.1% |
| 8 to 12 m | 398 | 613 | 466 | 17.1% | -24.0% | 7.7% | 9.1% | 8.3% |
| 12 to 16 m | 136 | 211 | 150 | 10.3% | -28.9% | 2.6% | 3.1% | 2.7% |
| More than 16 m | 50 | 66 | 67 | 34.0% | 1.5% | 1.0% | 1.0% | 1.2% |
| Total | 5.202 | 6,716 | 5,640 | 8.4% | -16.0% | 100.0% | 100.0% | 100.0% |
By type of vessel,The water bikes have the greatest fall (-30.2%), followed by sailboats (-16.8%), motor vessels (-12%), semi-rigid pneumatic vessels (-7.9%) and folding pneumatic vessels (-5.7%).
| Market | 2020 | 2021 | 2022 | % ^ 20 | % ^ 21 | % 20 / Tot. | % 21 / Tot. | % 22 / Tot. |
| METHODS OF WATER | 1,549 | 1,750 | 1.221 | -21.2% | -30.2% | 29.8% | 26.1% | 21.6% |
| BLOOD TO MOTOR | 2.105 | 2,992 | 2,633 | 25.1% | -12.0% | 40.5% | 44.6% | 46.7% |
| NEUMATIS | 594 | 649 | 612 | 3.0% | -5.7% | 11.4% | 9.7% | 10.9% |
| SEMIRRIGID NEUMATIS | 601 | 808 | 744 | 23.8% | -7.9% | 11.6% | 12.0% | 13.2% |
| VELA | 353 | 517 | 430 | 21.8% | -16.8% | 6.8% | 7.7% | 7.6% |
| Total | 5.202 | 6,716 | 5,640 | 8.4% | -16.0% | 100.0% | 100.0% | 100.0% |
The rental marketwhich has registered 1,900 vessels for this use, represents 34% of the global nautical market until November of this year, improving its data with a drop of only -0.6% over the same period of 2021.
Only the length less than 6 meters (-5%) and the water bikes (-22%) record negative data on the nautical charter market. The rest of the boats for rental use increase their registration, highlighting those of sailboats (30%) and those of folding pneumatic vessels (136%).
Enrolment by province
In the year's cumulative, Catalonia and the Balearic Islands remain the Autonomous Communities with the highest nautical activity, with market shares of 19.9% and 18.7%, respectively.
In the computation of enrolments, certain areas of the north such as Cantabria (+ 12.5%) and Guipúzcoa (+ 4.2%), and Girona in Catalonia (+ 2%) continue to increase records. The rest of the provinces maintain the falls of the previous months, in line with the situation on the nautical market.
In the charter market,the Balearic Islands continues to lead this market (32% share) and record a growth of the registration for charter (28.3%). It is also worth noting the increase in the registration of boats for rent in Ceuta, Cádiz, Gran Canaria, Tenerife, Tarragona, Murcia, Pontevedra and Cantabria.
Enrolment by EU Provinces - December 2022.
Source: ANEN with DGMM data
| Province | 2021 | 2022 | % ^ 21 | % 21 / Tot. | % 22 / Tot. |
| A CORUÑA | 162 | 159 | -1.85% | 2.41% | 2.82% |
| ALAVA | 3 | 8 | 166.67% | 0.04% | 0.14% |
| ALBACETE | 8 | 9 | 12.50% | 0.12% | 0.16% |
| ALICANTE | 502 | 345 | -31.27% | 7.47% | 6.12% |
| ALMERIA | 242 | 179 | -26.03% | 3.60% | 3.17% |
| ASTURIES | 84 | 54 | -35.71% | 1.25% | 0.96% |
| AVILA | 1 | 0 | -100,00% | 0.01% | 0,00% |
| BADAJOZ | 15 | 16 | 6.67% | 0.22% | 0.28% |
| BARCELONA | 694 | 595 | -14.27% | 10.33% | 10.55% |
| BURGOS | 3 | 5 | 66.67% | 0.04% | 0.09% |
| CACRES | 3 | 3 | 0,00% | 0.04% | 0.05% |
| CADIZ | 292 | 256 | -12.33% | 4.35% | 4.54% |
| CANTABRIA | 72 | 81 | 12.50% | 1.07% | 1.44% |
| CASTELLON | 87 | 55 | -36.78% | 1.30% | 0.98% |
| CEUTA | 40 | 17 | -57.50% | 0.60% | 0.30% |
| REAL CITY | 8 | 2 | -75.00% | 0.12% | 0.04% |
| CORDOBA | 37 | 27 | -27.03% | 0.55% | 0.48% |
| QUENCA | 2 | 0 | -100,00% | 0.03% | 0,00% |
| GIRONA | 387 | 395 | 2.07% | 5.76% | 7.00% |
| GRANADA | 126 | 114 | -9.52% | 1.88% | 2.02% |
| GUADALAJARA | 7 | 3 | -57.14% | 0.10% | 0.05% |
| GUIPUZCOA | 48 | 50 | 4.17% | 0.71% | 0.89% |
| BELVA | 252 | 150 | -40.48% | 3.75% | 2.66% |
| BESCA | 3 | 2 | -33.33% | 0.04% | 0.04% |
| BALEAR ISLANDS | 1.129 | 1,056 | -6.47% | 16.81% | 18.72% |
| JAEN | 6 | 7 | 16.67% | 0.09% | 0.12% |
| THE RIOJA | 9 | 12 | 33.33% | 0.13% | 0.21% |
| THE PALMAS | 160 | 148 | -7.50% | 2.38% | 2.62% |
| LEON | 7 | 17 | 142.86% | 0.10% | 0.30% |
| LLEIDA | 14 | 11 | -21.43% | 0.21% | 0.20% |
| LIGHT | 25 | 12 | -52.00% | 0.37% | 0.21% |
| MADRID | 419 | 374 | -10.74% | 6.24% | 6.63% |
| MALAGA | 360 | 308 | -14.44% | 5.36% | 5.46% |
| MELILLA | 34 | 22 | -35.29% | 0.51% | 0.39% |
| MURCIA | 294 | 257 | -12.59% | 4.38% | 4.56% |
| NAVARRA | 10 | 12 | 20.00% | 0.15% | 0.21% |
| OURENSE | 5 | 8 | 60,00% | 0.07% | 0.14% |
| PALENCY | 1 | 0 | -100,00% | 0.01% | 0,00% |
| PONTEVEDRA | 198 | 178 | -10.10% | 2.95% | 3.16% |
| SALAMANCA | 5 | 2 | -60,00% | 0.07% | 0.04% |
| _ | 184 | 128 | -30.43% | 2.74% | 2.27% |
| SEGOVIA | 2 | 1 | -50,00% | 0.03% | 0.02% |
| _ | 151 | 112 | -25.83% | 2.25% | 1.99% |
| SORIA | 3 | 1 | -66.67% | 0.04% | 0.02% |
| TARRAGONA | 132 | 123 | -6.82% | 1.97% | 2.18% |
| TERUEL | 1 | 1 | 0,00% | 0.01% | 0.02% |
| TOLEDO | 9 | 9 | 0,00% | 0.13% | 0.16% |
| VALENCE | 310 | 184 | -40,65% | 4.62% | 3.26% |
| VALLADOLID | 3 | 7 | 133.33% | 0.04% | 0.12% |
| VIZCAYA | 140 | 100 | -28.57% | 2.08% | 1.77% |
| ZAMORA | 2 | 3 | 50,00% | 0.03% | 0.05% |
| ZARAGOZA | 25 | 22 | -12.00% | 0.37% | 0.39% |
| Total | 6716 | 5640 | -16.0% | 100.0% | 100.0% |
© 2024 Nautica Digital Europe - www.nauticadigital.eu


