Bad times for lyrical drop enrolments 17 points in September
Bad times for lyrical drop enrolments 17 points in September

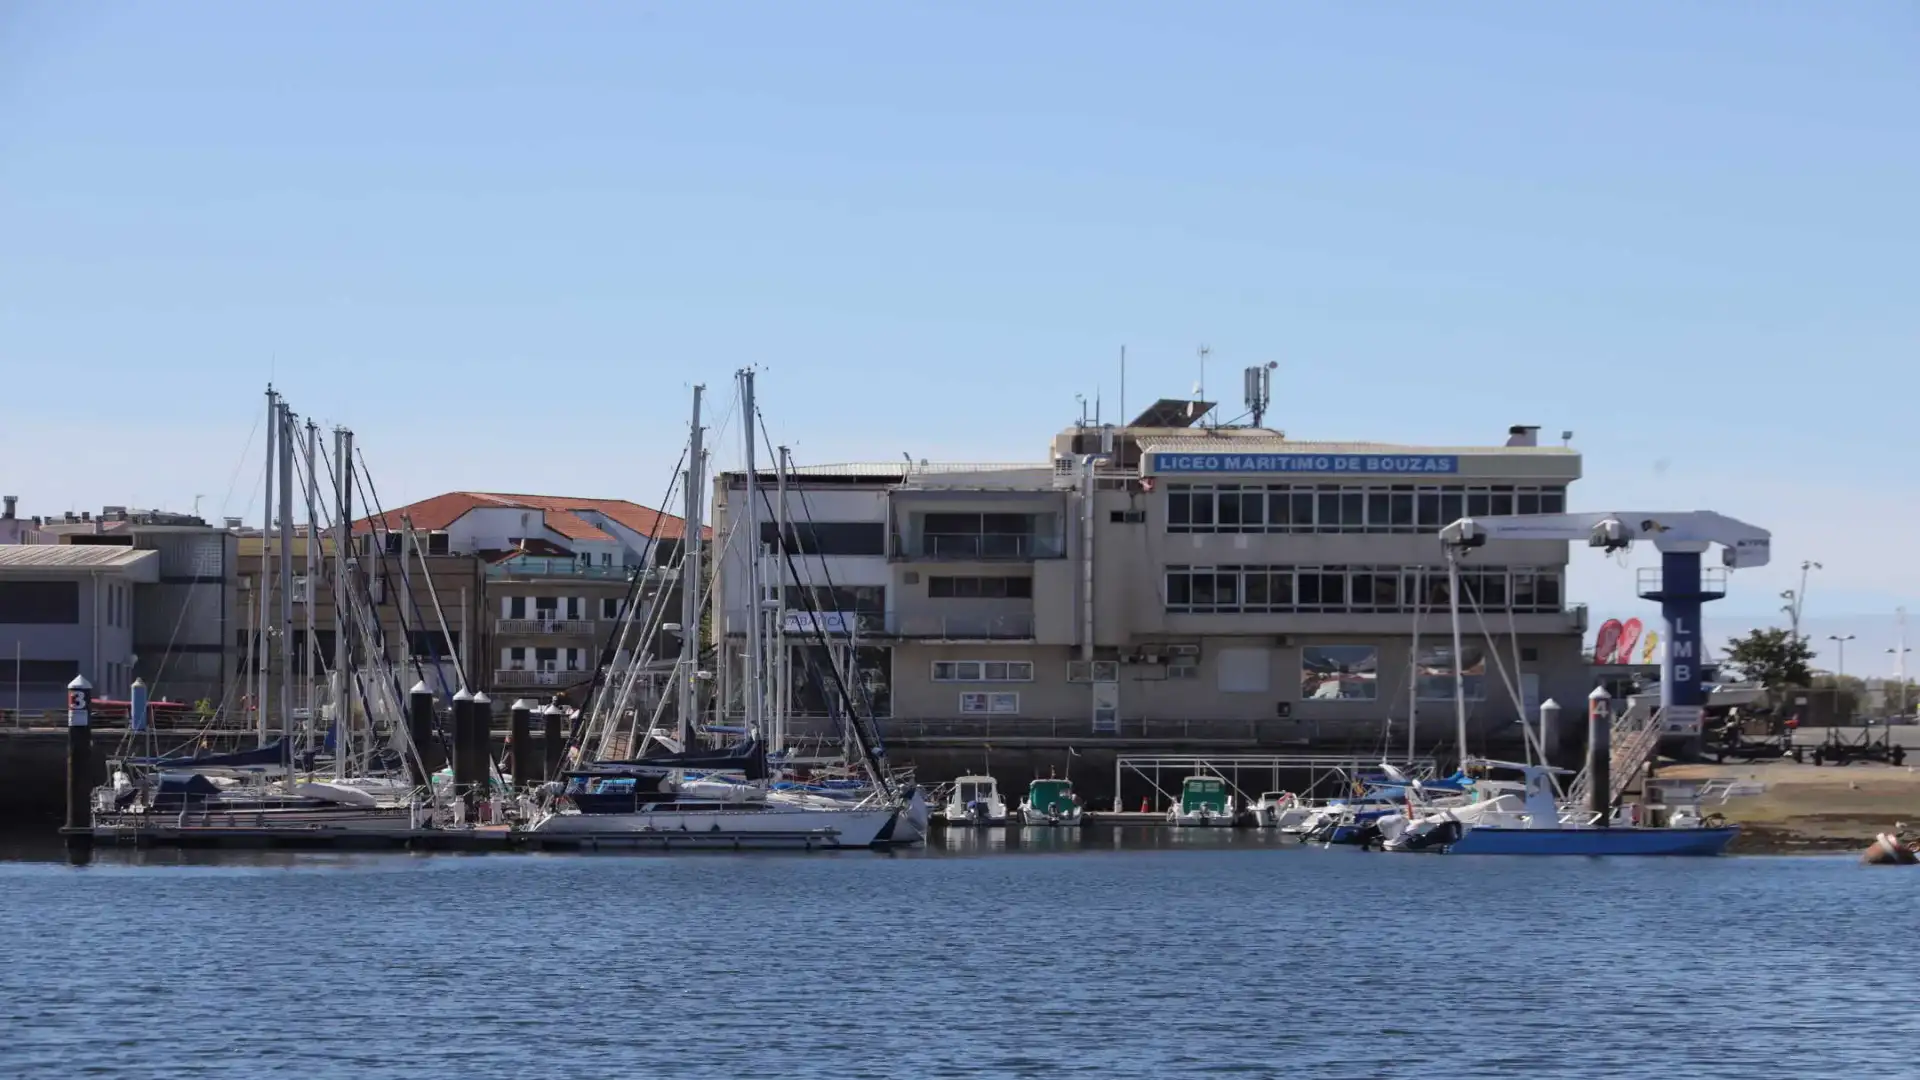
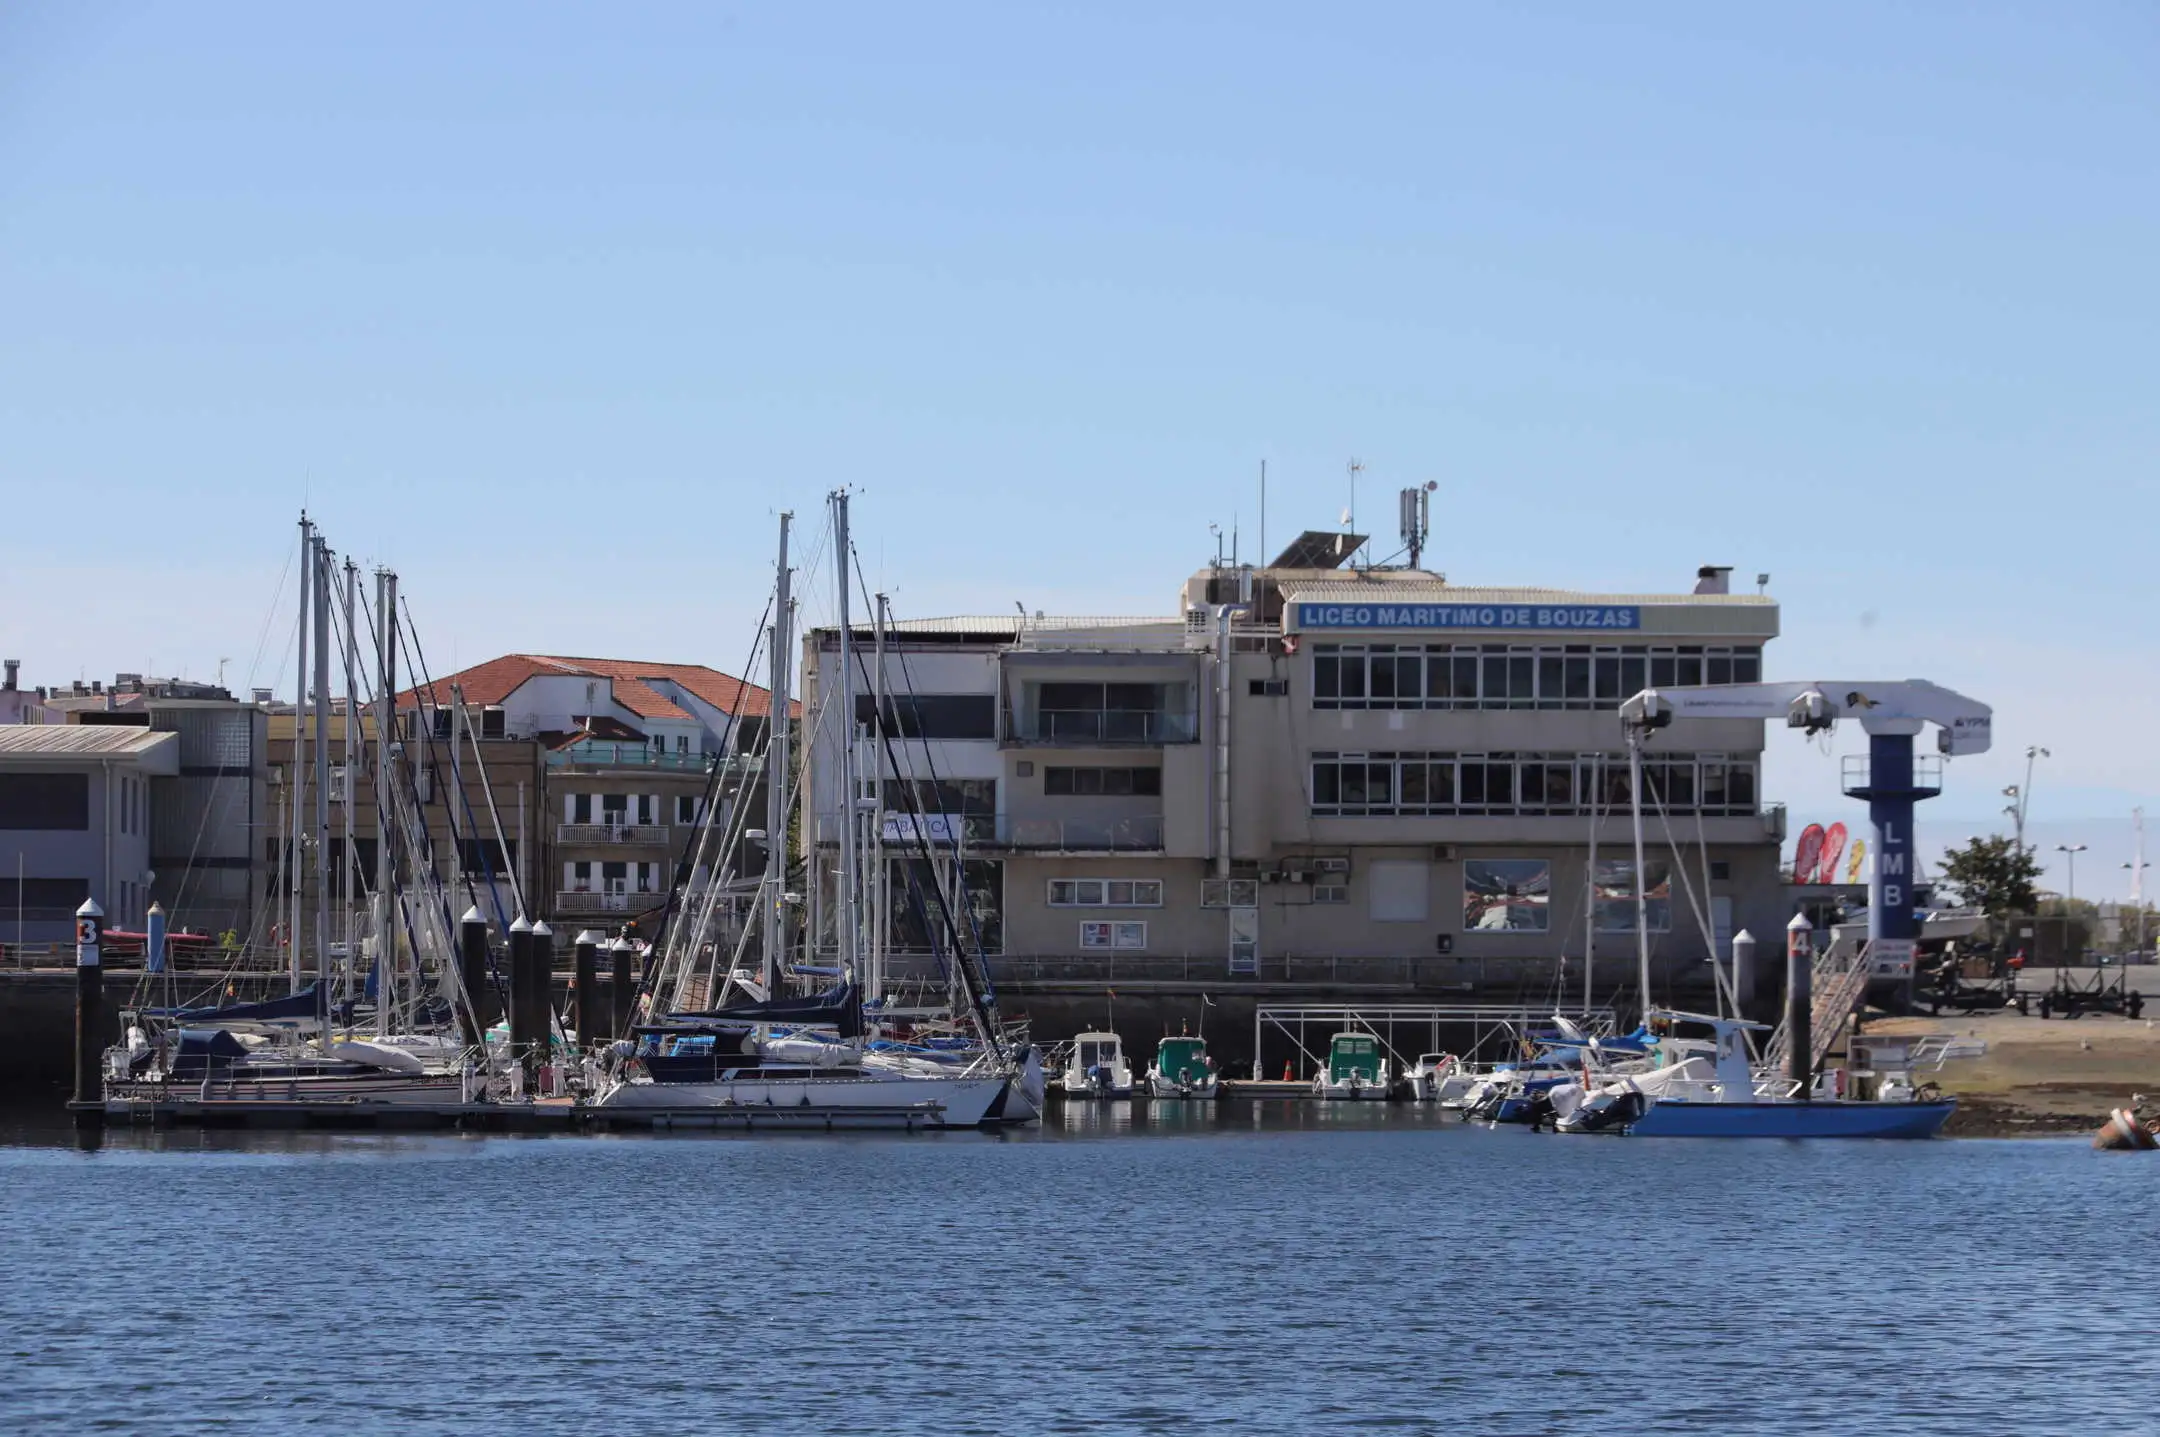
These are the data collected in the Energy-September, 2022, published by ANEN from the data provided by the General Directorate of the Merchant Navy (Photo Pedro Seoane)
Until September, 5200 recreational boats have been registered in Spain, 17 per cent less than those recorded in the same period of 2021... in which the number of registered sports boats has been raised... and it seems that the difficulties in origin, in what are the supplies... is caused by the delay in deliveries in certain segments of ships and nautical motorcycles and by the stabilization of the nautical market that, following the increase in the purchase of recreational boats during the pandemic in line with the rise of nautical tourism, is back to 2019.
NATIC MARKET DATA
By length
In the period under review, the vessels over 16 meters increase their registration by 6.8%, while the rest of the length falls, the ships between 12 and 16 meters being the most affected (-26%).
| Length | 2020 | 2021 | 2022 | % ^ 20 | % ^ 21 | % 20 / Tot. | % 21 / Tot. | % 22 / Tot. |
| Up to 6 m | 3,419 | 4,386 | 3,520 | 3.0% | -19.7% | 71.4% | 70,1% | 67.7% |
| 6 to 8 m | 861 | 1,071 | 1,023 | 18.8% | -4.5% | 18.0% | 17.1% | 19.7% |
| 8 to 12 m | 351 | 549 | 451 | 28.5% | -17.9% | 7.3% | 8.8% | 8.7% |
| 12 to 16 m | 116 | 193 | 143 | 23.3% | -25.9% | 2.4% | 3.1% | 2.8% |
| More than 16 m | 39 | 59 | 63 | 61.5% | 6.8% | 0.8% | 0.9% | 1.2% |
| Total | 4,786 | 6,258 | 5,200 | 8.7% | -16.9% | 100.0% | 100.0% | 100.0% |
By type of vessel,The water bikes have the greatest fall (-35%), followed by sailboats (-14%), folding pneumatic vessels (-12%), motor vessels (-10%) and semi-rated pneumatic vessels (-5%).
| Market | 2020 | 2021 | 2022 | % ^ 20 | % ^ 21 | % 20 / Tot. | % 21 / Tot. | % 22 / Tot. |
| METHODS OF WATER | 1.510 | 1,722 | 1.120 | -25.8% | -35.0% | 31.6% | 27.5% | 21.5% |
| BLOOD TO MOTOR | 1.901 | 2,763 | 2,481 | 30.5% | -10.2% | 39.7% | 44.2% | 47.7% |
| NEUMATIS | 534 | 573 | 501 | -6.2% | -12.6% | 11.2% | 9.2% | 9.6% |
| SEMIRRIGID NEUMATIS | 540 | 737 | 700 | 29.6% | -5,0% | 11.3% | 11.8% | 13.5% |
| VELA | 301 | 463 | 398 | 32.2% | -14.0% | 6.3% | 7.4% | 7.7% |
| Total | 4,786 | 6,258 | 5,200 | 8.7% | -16.9% | 100.0% | 100.0% | 100.0% |
The rental market, which represents 35% of the nautical market, has 1,820 registration of vessels for commercial use (nautical charter) in the period enero-September of this year, with a decrease of -1.8%, which improves the data recorded in the period enero-August (-3%) and which is caused by the fall of registration of water bikes in this market (-25%).
The remaining segments of vessels intended for nautical charter increase their registration during the period under review.
Enrolment by province
In the year, Catalonia and the Balearic Islands are located as the Autonomous Communities with the highest nautical activity, with market shares of 20,5% and 19,3%, respectively.
In the calculation of registrations, with the exception of certain coastal areas in the north such as Guipúzcoa and Cantabria where enrolment increases by about 10%, the rest of the provinces fall from the same period of 2021, in line with the situation on the nautical market.
In the charter market,The Balearic Islands continues to lead this market (32% share) and to record the highest growth in charter registration (28.5%) in coastal territories. They also present data on the growth of Cadiz, Las Palmas, Tarragona, Cantabria, Santa Cruz de Tenerife, Murcia, A Coruña and Pontevedra enrolment.
| Province | 2021 | 2022 | % ^ 21 | % 21 / Tot. | % 22 / Tot. |
| A CORUÑA | 145 | 137 | -5.52% | 2.32% | 2.63% |
| ALAVA | 3 | 7 | 133.33% | 0.05% | 0.13% |
| ALBACETE | 7 | 9 | 28.57% | 0.11% | 0.17% |
| ALICANTE | 476 | 328 | -31.09% | 7.61% | 6.31% |
| ALMERIA | 221 | 161 | -27.15% | 3.53% | 3.10% |
| ASTURIES | 77 | 49 | -36.36% | 1.23% | 0.94% |
| AVILA | 1 | 0 | -100,00% | 0.02% | 0,00% |
| BADAJOZ | 15 | 15 | 0,00% | 0.24% | 0.29% |
| BARCELONA | 658 | 563 | -14.44% | 10.51% | 10.83% |
| BURGOS | 3 | 4 | 33.33% | 0.05% | 0.08% |
| CACRES | 2 | 2 | 0,00% | 0.03% | 0.04% |
| CADIZ | 267 | 222 | -16.85% | 4.27% | 4.27% |
| CANTABRIA | 70 | 77 | 10.00% | 1.12% | 1.48% |
| CASTELLON | 84 | 54 | -35.71% | 1.34% | 1.04% |
| CEUTA | 38 | 16 | -57.89% | 0.61% | 0.31% |
| REAL CITY | 8 | 2 | -75.00% | 0.13% | 0.04% |
| CORDOBA | 35 | 24 | -31.43% | 0.56% | 0.46% |
| QUENCA | 1 | 0 | -100,00% | 0.02% | 0,00% |
| GIRONA | 377 | 375 | -0.53% | 6.02% | 7.21% |
| GRANADA | 119 | 101 | -15.13% | 1.90% | 1.94% |
| GUADALAJARA | 6 | 3 | -50,00% | 0.10% | 0.06% |
| GUIPUZCOA | 41 | 46 | 12.20% | 0.66% | 0.88% |
| BELVA | 236 | 136 | -42.37% | 3.77% | 2.62% |
| BESCA | 2 | 1 | -50,00% | 0.03% | 0.02% |
| BALEAR ISLANDS | 1,063 | 1.003 | -5.64% | 16.99% | 19.29% |
| JAEN | 4 | 7 | 75.00% | 0.06% | 0.13% |
| THE RIOJA | 9 | 12 | 33.33% | 0.14% | 0.23% |
| THE PALMAS | 135 | 122 | -9.63% | 2.16% | 2.35% |
| LEON | 6 | 16 | 166.67% | 0.10% | 0.31% |
| LLEIDA | 13 | 10 | -23.08% | 0.21% | 0.19% |
| LIGHT | 25 | 11 | -56.00% | 0.40% | 0.21% |
| MADRID | 397 | 352 | -11.34% | 6.34% | 6.77% |
| MALAGA | 329 | 280 | -14.89% | 5.26% | 5.38% |
| MELILLA | 32 | 21 | -34.38% | 0.51% | 0.40% |
| MURCIA | 269 | 235 | -12.64% | 4.30% | 4.52% |
| NAVARRA | 9 | 11 | 22.22% | 0.14% | 0.21% |
| OURENSE | 5 | 6 | 20.00% | 0.08% | 0.12% |
| PALENCY | 1 | 0 | -100,00% | 0.02% | 0,00% |
| PONTEVEDRA | 183 | 155 | -15.30% | 2.92% | 2.98% |
| SALAMANCA | 5 | 2 | -60,00% | 0.08% | 0.04% |
| _ | 159 | 109 | -31.45% | 2.54% | 2.10% |
| SEGOVIA | 2 | 1 | -50,00% | 0.03% | 0.02% |
| _ | 139 | 102 | -26.62% | 2.22% | 1.96% |
| SORIA | 2 | 1 | -50,00% | 0.03% | 0.02% |
| TARRAGONA | 125 | 115 | -8.00% | 2.00% | 2.21% |
| TERUEL | 1 | 1 | 0,00% | 0.02% | 0.02% |
| TOLEDO | 9 | 8 | -11.11% | 0.14% | 0.15% |
| VALENCE | 284 | 169 | -40.49% | 4.54% | 3.25% |
| VALLADOLID | 3 | 6 | 100,00% | 0.05% | 0.12% |
| VIZCAYA | 132 | 88 | -33.33% | 2.11% | 1.69% |
| ZAMORA | 2 | 3 | 50,00% | 0.03% | 0.06% |
| ZARAGOZA | 23 | 22 | -4.35% | 0.37% | 0.42% |
| Total | 6258 | 5200 | -16.9% | 100.0% | 100.0% |
© 2024 Nautica Digital Europe - www.nauticadigital.eu


