The nautical market is 17 points down until August
The nautical market is 17 points down until August

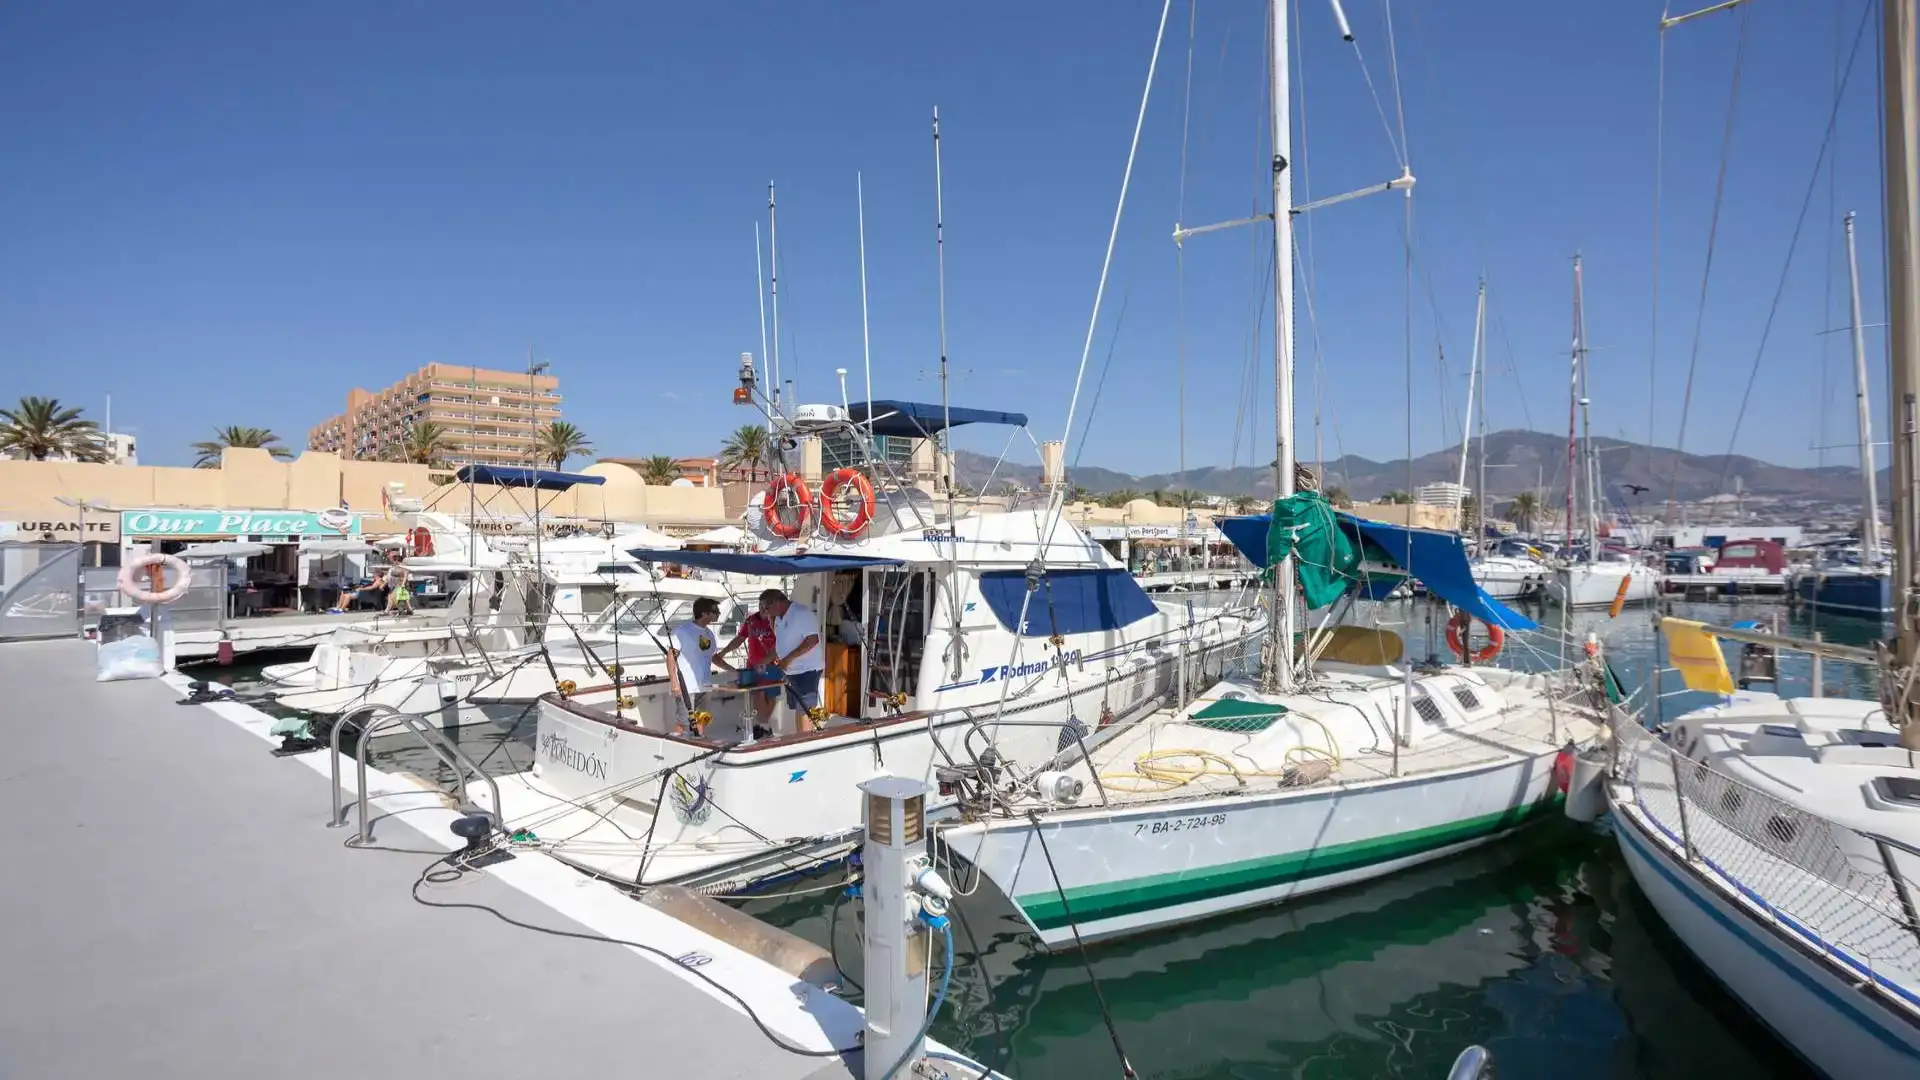
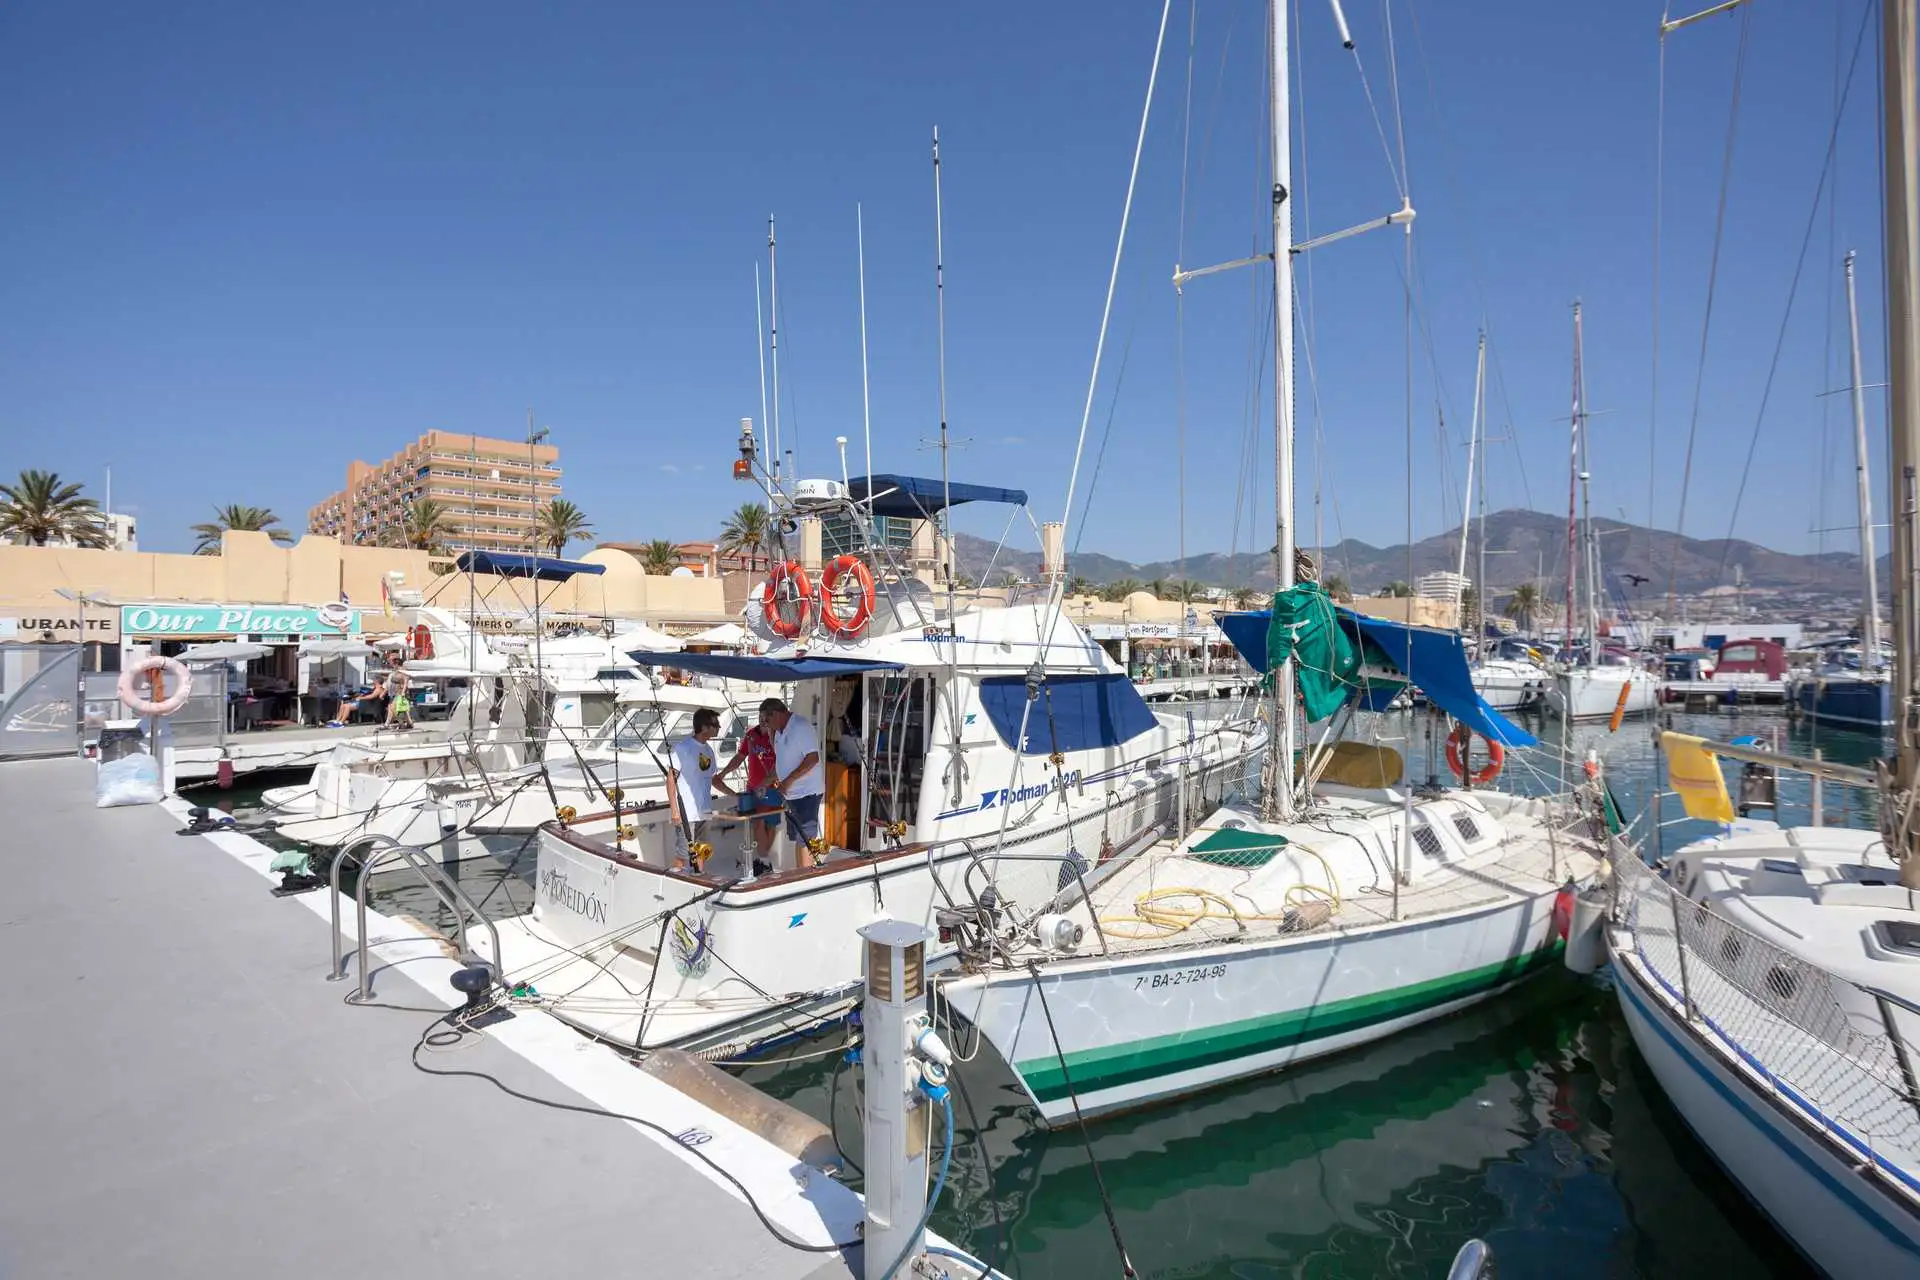
The stabilization of the nautical market, after two years of sustained growth, is reflected in the data of enrollments that keep the decline of 17% until the end of August, despite the vagaries of the world economy. As for the demand, the nautical season is being positive, with a growth of recreational navigation on our shores that we did not see long ago. Making nautical tourism and enjoying the free time sailing has been placed among the first options as a holiday plan in Spain (Carlos Sanlorenzo, secretary general of ANEN) (Photo Pedro Seoane)
As of August of this year, 4,925 recreational boats have been registered in Spain compared to the 5,943 registered in the same period last year, which is a decrease of -17%... are the data collected in the Report of the market for recreational craft.
In length... all segments fall except for vessels over 16 meters that grow almost 2% in the period analysed, compared to the same period of 2021. The ships less affected by the fall are those of length between 6 and 8 meters (-3.5%). The ships below 6 meters fall by -20.6%, the ships between 8 and 12 meters by -16.4%, and the segment between 12 and 16 meters shows a decrease of -22.7%.
| Length | 2020 | 2021 | 2022 | % ^ 20 | % ^ 21 | % 20 / Tot. | % 21 / Tot. | % 22 / Tot. |
| Up to 6 m | 3.192 | 4.169 | 3.312 | 3.8% | -20.6% | 71.5% | 70,1% | 67.2% |
| 6 to 8 m | 802 | 1,021 | 985 | 22.8% | -3.5% | 18.0% | 17.2% | 20.0% |
| 8 to 12 m | 325 | 517 | 432 | 32.9% | -16.4% | 7.3% | 8.7% | 8.8% |
| 12 to 16 m | 106 | 181 | 140 | 32.1% | -22.7% | 2.4% | 3.0% | 2.8% |
| More than 16 m | 38 | 55 | 56 | 47.4% | 1.8% | 0.9% | 0.9% | 1.1% |
| Total | 4,463 | 5,943 | 4,925 | 10.4% | -17.1% | 100.0% | 100.0% | 100.0% |
By type of vessels, all markets have a decrease in registration, with a lower impact on semi-rigid pneumatic (-3%), followed by motor vessels (-10%), folding pneumatic (-11.8%), sailboats (-13.6%) and water bikes that remain the market with the greatest fall due to the supply crisis (-36.8%).
| Market | 2020 | 2021 | 2022 | % ^ 20 | % ^ 21 | % 20 / Tot. | % 21 / Tot. | % 22 / Tot. |
| METHODS OF WATER | 1.462 | 1,654 | 1,045 | -28.5% | -36.8% | 32.8% | 27.8% | 21.2% |
| BLOOD TO MOTOR | 1,775 | 2,640 | 2.373 | 33.7% | -10.1% | 39.8% | 44.4% | 48.2% |
| PLE NEUMATIS | 465 | 525 | 463 | -0.4% | -11.8% | 10.4% | 8.8% | 9.4% |
| SEMI NEUMATIS | 490 | 689 | 668 | 36.3% | -3.0% | 11.0% | 11.6% | 13.6% |
| VELA | 271 | 435 | 376 | 38.7% | -13.6% | 6.1% | 7.3% | 7.6% |
| Total | 4,463 | 5,943 | 4,925 | 10.4% | -17.1% | 100.0% | 100.0% | 100.0% |
The rental market records 1,744 commercial registration of vessels (nautical charter) in the period enero-August of this year, reducing the decline of the preceding months and recording a slight decrease of -3% compared to 2021, due to the fall of the registration of water bikes (-29%).
The remaining segments of vessels for commercial use have grown in the period under review and the charter market already accounts for 35.5% of the global nautical market.
The practice of all coastal provinces continues to decline in the enrolment of recreational boats. The decline in the enrolment of recreational boats affects the practice of all provinces. The Balearic Islands remains the territory with the highest nautical activity (19.5% market share in the period under review). In the computation of enrolments, in the coastal provinces, Guipuzcoa continues to stand out with a growth of 35%.
In the charter market, the Balearic Islands continues to lead this market (32.4% share) and to record the highest growth in charter registration (27%) in coastal territories. They also present data on the growth of Cadiz, Las Palmas, Santa Cruz de Tenerife, Tarragona, Cantabria, Murcia, A Coruña and Pontevedra enrolment.
Enrolment by EU Provinces - August 2022.
Source: ANEN with DGMM data
| Province | 2021 | 2022 | % ^ 21 | % 21 / Tot. | % 22 / Tot. |
| A CORUÑA | 137 | 132 | -3.65% | 2.31% | 2.68% |
| ALAVA | 3 | 7 | 133.33% | 0.05% | 0.14% |
| ALBACETE | 7 | 8 | 14.29% | 0.12% | 0.16% |
| ALICANTE | 449 | 312 | -30.51% | 7.56% | 6.34% |
| ALMERIA | 210 | 151 | -28.10% | 3.53% | 3.07% |
| ASTURIES | 71 | 47 | -33.80% | 1.19% | 0.95% |
| AVILA | 0 | 0 | 0,00% | 0,00% | |
| BADAJOZ | 14 | 13 | -7.14% | 0.24% | 0.26% |
| BARCELONA | 638 | 543 | -14.89% | 10.74% | 11.03% |
| BURGOS | 3 | 4 | 33.33% | 0.05% | 0.08% |
| CACRES | 2 | 2 | 0,00% | 0.03% | 0.04% |
| CADIZ | 256 | 211 | -17.58% | 4.31% | 4.28% |
| CANTABRIA | 68 | 71 | 4.41% | 1.14% | 1.44% |
| CASTELLON | 79 | 52 | -34.18% | 1.33% | 1.06% |
| CEUTA | 34 | 15 | -55.88% | 0.57% | 0.30% |
| REAL CITY | 8 | 2 | -75.00% | 0.13% | 0.04% |
| CORDOBA | 33 | 23 | -30.30% | 0.56% | 0.47% |
| QUENCA | 1 | 0 | -100,00% | 0.02% | 0,00% |
| GIRONA | 361 | 360 | -0.28% | 6.07% | 7.31% |
| GRANADA | 114 | 100 | -12.28% | 1.92% | 2.03% |
| GUADALAJARA | 6 | 2 | -66.67% | 0.10% | 0.04% |
| GUIPUZCOA | 34 | 46 | 35.29% | 0.57% | 0.93% |
| BELVA | 225 | 126 | -44.00% | 3.79% | 2.56% |
| BESCA | 1 | 0 | -100,00% | 0.02% | 0,00% |
| BALEARES | 1.015 | 958 | -5.62% | 17.08% | 19.45% |
| JAEN | 3 | 7 | 133.33% | 0.05% | 0.14% |
| THE RIOJA | 9 | 11 | 22.22% | 0.15% | 0.22% |
| THE PALMAS | 125 | 109 | -12.80% | 2.10% | 2.21% |
| LEON | 4 | 16 | 300,00% | 0.07% | 0.32% |
| LLEIDA | 12 | 10 | -16.67% | 0.20% | 0.20% |
| LIGHT | 24 | 11 | -54.17% | 0.40% | 0.22% |
| MADRID | 376 | 331 | -11.97% | 6.33% | 6.72% |
| MALAGA | 310 | 260 | -16.13% | 5.22% | 5.28% |
| MELILLA | 32 | 21 | -34.38% | 0.54% | 0.43% |
| MURCIA | 261 | 218 | -16.48% | 4.39% | 4.43% |
| NAVARRA | 9 | 11 | 22.22% | 0.15% | 0.22% |
| OURENSE | 4 | 6 | 50,00% | 0.07% | 0.12% |
| PALENCY | 1 | 0 | -100,00% | 0.02% | 0,00% |
| PONTEVEDRA | 170 | 146 | -14.12% | 2.86% | 2.96% |
| SALAMANCA | 5 | 2 | -60,00% | 0.08% | 0.04% |
| TENERIFE | 144 | 96 | -33.33% | 2.42% | 1.95% |
| SEGOVIA | 2 | 1 | -50,00% | 0.03% | 0.02% |
| _ | 133 | 97 | -27.07% | 2.24% | 1.97% |
| SORIA | 2 | 1 | -50,00% | 0.03% | 0.02% |
| TARRAGONA | 118 | 105 | -11.02% | 1.99% | 2.13% |
| TERUEL | 0 | 1 | 0,00% | 0.02% | |
| TOLEDO | 7 | 8 | 14.29% | 0.12% | 0.16% |
| VALENCE | 274 | 156 | -43.07% | 4.61% | 3.17% |
| VALLADOLID | 3 | 6 | 100,00% | 0.05% | 0.12% |
| VIZCAYA | 123 | 85 | -30.89% | 2.07% | 1.73% |
| ZAMORA | 2 | 3 | 50,00% | 0.03% | 0.06% |
| ZARAGOZA | 21 | 22 | 4.76% | 0.35% | 0.45% |
| Total | 5943 | 4925 | -17.1% | 100.0% | 100.0% |
© 2024 Nautica Digital Europe - www.nauticadigital.eu


