


Enrolments grow 12 points until November compared to 2019
Enrolments grow 12 points until November compared to 2019

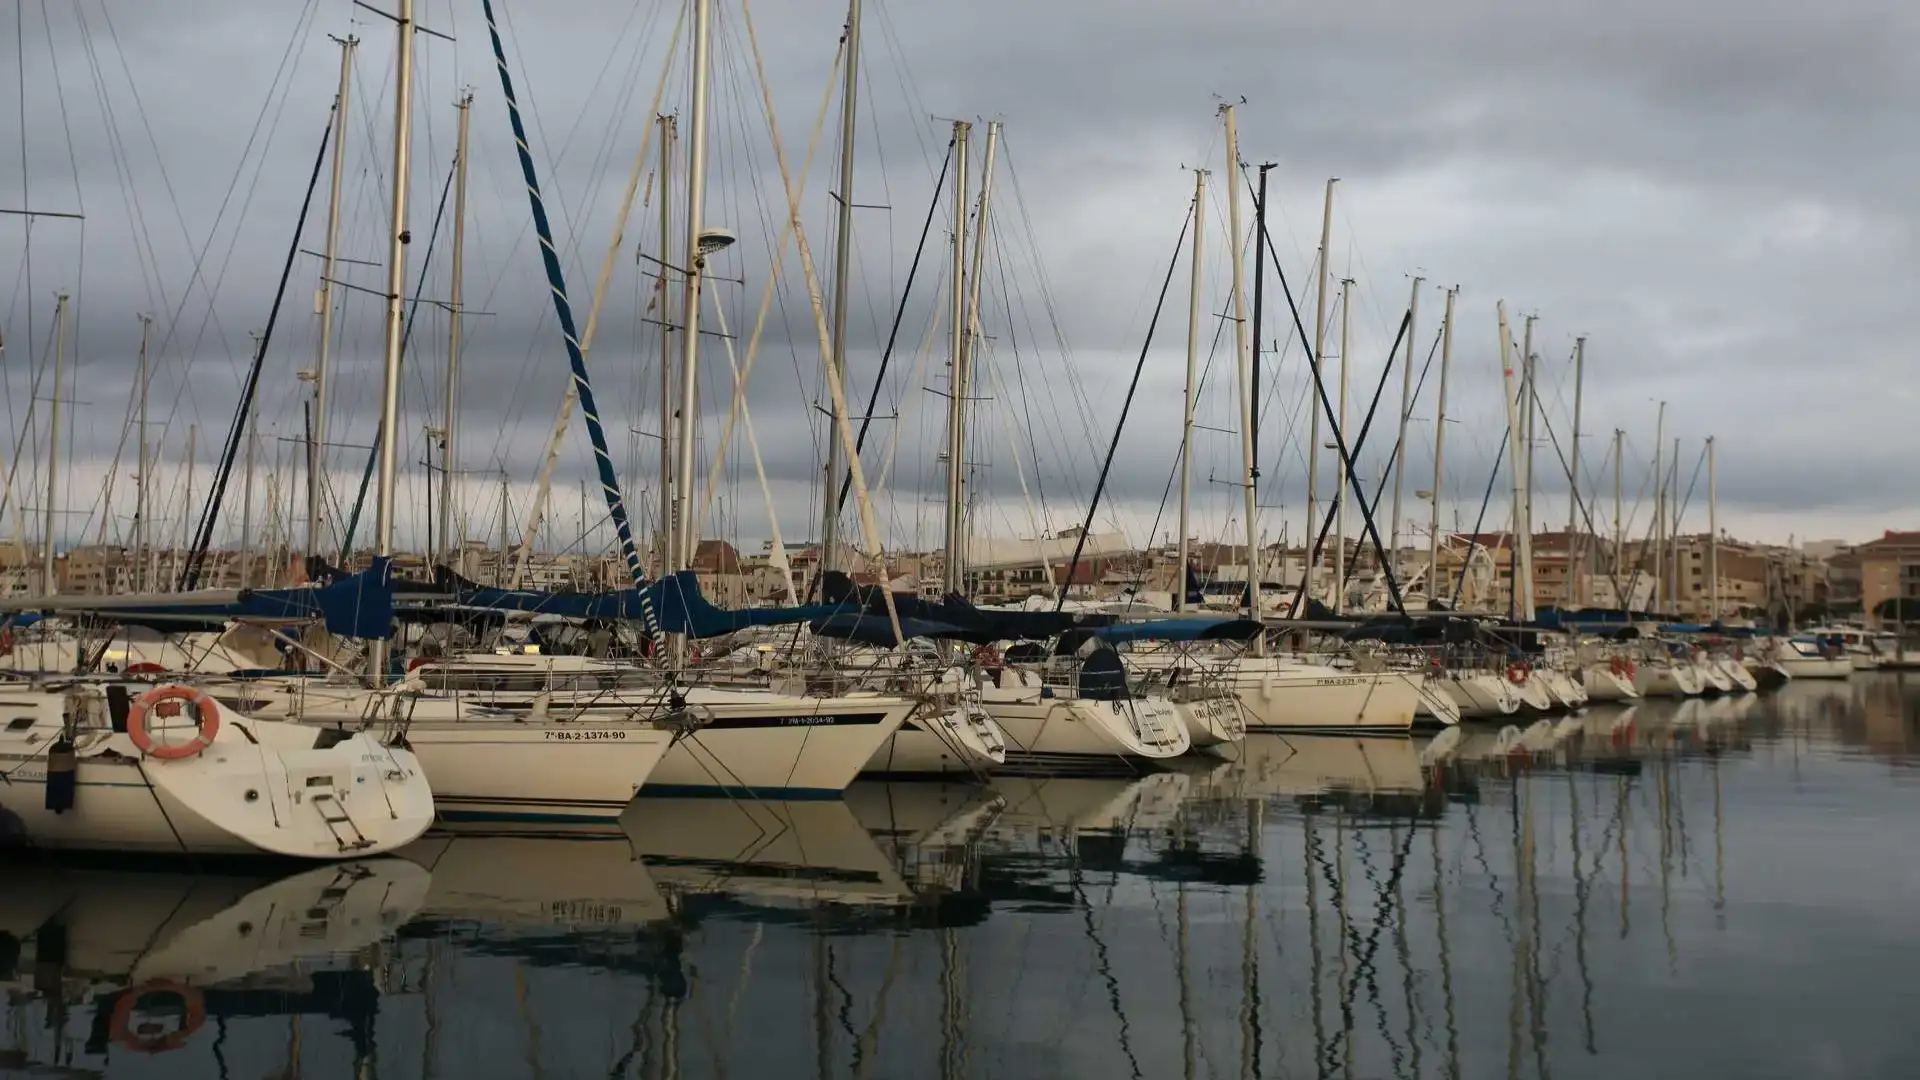
The nautical sector faces the 2022 with a good position, with capacity as an economic engine driving the consumption of leisure and employment, with a offer of qualitative nautical tourism that is among the ones that have experienced the highest demand in the national market during the pandemic (Photo Pedro Seoane)
The nautical market concludes in November with a growth in the registration of recreational boats, in the cumulative one of the year (energy-November), of 12% with respect to the same period of 2019. In Spain, 6,716 recreational vessels have been registered, compared with 5,976 in the same period in 2019 and 5,202 in 2020. Of the total number of registered registrations, 71.5% are for private-use vessels and 28.5% for vessels for the nautical charter.
These are the data collected in the Report on the market for energy recreational craft - November 2021, edited by ANEN on the basis of the data provided by the General Directorate of the Merchant Navy.
As a result, all segments of the year are growing: With respect to 2019, smaller vessels, up to 8 metres in length, remain the most demanding (86.8% of the nautical market) and have a growth of 10.1%. The segment between 8 and 12 meters in length accounts for 9.1% of the nautical market and grows by 26%. The length between 12 and 16 meters (3.1% of the nautical market) enrol 16.6% more units and the larger vessels, more than 16 meters (1% of the nautical market) have registered 66 units in the period under review and have recorded a growth of 10% with repecto to the same period of 2019.
| Length | 2019 | 2020 | 2021 | % ^ 19 | % ^ 20 | % 19 / Tot. | % 20 / Tot. | % 21 / Tot. |
| Up to 6 m | 4,200 | 3,697 | 4.666 | 11.1% | 26.2% | 70.3% | 71.1% | 69.5% |
| 6 to 8 m | 1,059 | 921 | 1.160 | 9.5% | 26.0% | 17.7% | 17.7% | 17.3% |
| 8 to 12 m | 476 | 398 | 613 | 28.8% | 54.0% | 8.0% | 7.7% | 9.1% |
| 12 to 16 m | 181 | 136 | 211 | 16.6% | 55.1% | 3.0% | 2.6% | 3.1% |
| More than 16 m | 60 | 50 | 66 | 10.0% | 32.0% | 1.0% | 1.0% | 1.0% |
| Total | 5,976 | 5.202 | 6,716 | 12.4% | 29.1% | 100.0% | 100.0% | 100.0% |
By type of vessel
In relation to 2019 data, motor ships remain the most demanding (44.2% of the market) and register 16.2% more of ships. Water bikes, the next market with the highest demand (26% of the market), are growing by 9.4% in enrolment over the same period in 2019.
Sailboats (8% of the nautical market) continue to grow above average (39.3%). And the semi-rigid and folding pneumatic vessels, most affected together with the water bikes due to the lack of supplies, also grow in enrollments in the period analysed in respect of 2019, 2.2% for the folding, and 1.3% for the semi-rigid pneumatic.
| Market | 2019 | 2020 | 2021 | % ^ 19 | % ^ 20 | % 19 / Tot. | % 20 / Tot. | % 21 / Tot. |
| METHODS OF WATER | 1,600 | 1,549 | 1,750 | 9.4% | 13.0% | 26.8% | 29.8% | 26.1% |
| BLOOD TO MOTOR | 2,556 | 2,087 | 2,970 | 16.2% | 42.3% | 42.8% | 40.1% | 44.2% |
| NEUMATIS | 635 | 594 | 649 | 2.2% | 9.3% | 10.6% | 11.4% | 9.7% |
| SEMIRRIGID NEUMATIS | 798 | 601 | 808 | 1.3% | 34.4% | 13.4% | 11.6% | 12.0% |
| VELA | 387 | 371 | 539 | 39.3% | 45.3% | 6.5% | 7.1% | 8.0% |
| Total | 5,976 | 5.202 | 6,716 | 12.4% | 29.1% | 100.0% | 100.0% | 100.0% |
The rental market maintains good behaviour, it grows by 21.4% until November of this year compared with the same period of 2019, with 1,911 registrations of recreational boats for the charter, which account for 28.5% of the total registration of recreational vessels registered in Spain.
Andalusia with the highest market share (21.83%) has grown by 29.17% in registered units over the same period in 2019 and by 27.1% over 2020. It is followed by Catalonia which represents 18.27% of the nautical market and has grown by 16.6% in enrolment over the same period of 2019 and 51.76% over 2020. The Balearic Islands, the third autonomous community per market share (16.81%), increases its enrolment by 1.07% over the same period in 2019 and 14.38% over 2020.
The Community of Valencia, Madrid and the rest of the Communities are behind the market share.
| C. Autonomous | 2019 | 2020 | 2021 | % ^ 2019 | % ^ 2020 | % Market 2021 |
| Enrolment units | ||||||
| Andalusia | 1,135 | 1.153 | 1.466 | 29.1% | 27.1% | 21.83% |
| Aragon | 23 | 16 | 29 | 26% | 81.2% | 0.42% |
| Asturias | 69 | 55 | 84 | 21.7% | 52.7% | 1.25% |
| Balearic Islands | 1.117 | 987 | 1.129 | 1.07% | 14.38% | 16.81% |
| Canary Islands | 391 | 317 | 344 | -12% | 8.51% | 5.12% |
| Cantabria | 63 | 96 | 72 | 14.3% | -25% | 1.07% |
| Castilla - La Mancha | 29 | 29 | 34 | 17.2% | 17.2% | 0.5% |
| Castles | 40 | 27 | 27 | -32.5% | 0 | 0.37% |
| Catalonia | 1.109 | 809 | 1.227 | 10.6% | 51.7% | 18.27% |
| Ceuta and Melilla | 58 | 45 | 74 | 27.6% | 64.4% | 1.11% |
| Com.Valenciana | 664 | 589 | 899 | 35.5% | 52.6% | 13.39% |
| Extreme | 17 | 22 | 18 | 5.9% | -18.2% | 0.26% |
| Galicia | 384 | 338 | 390 | 1.6% | 15.38% | 5.8% |
| La Rioja | 13 | 6 | 9 | -30.7% | 50% | 0.13% |
| Madrid | 380 | 326 | 419 | 10.3% | 28.5% | 6.24% |
| Murcia | 246 | 248 | 294 | 19.5% | 18.5% | 4.38% |
| Navarra | 16 | 9 | 10 | -37.5 | 11.1% | 0.15% |
| Basque Country | 175 | 130 | 191 | 9.14% | 46.9% | 2.83% |
| TOTALES | 5,976 | 5.202 | 6,716 | 12.38% | 29.10% | 100% |
In the charter market (energy-November 2021), the Baleres Islands head the rental market with 24.6% share, followed by Catalonia (20.4%), the Valencia Community (18.4%) and Andalusia (16.2%).
© 2024 Nautica Digital Europe - www.nauticadigital.eu


