The nautical market closes until August with 10 points more than in 2019
The nautical market closes until August with 10 points more than in 2019

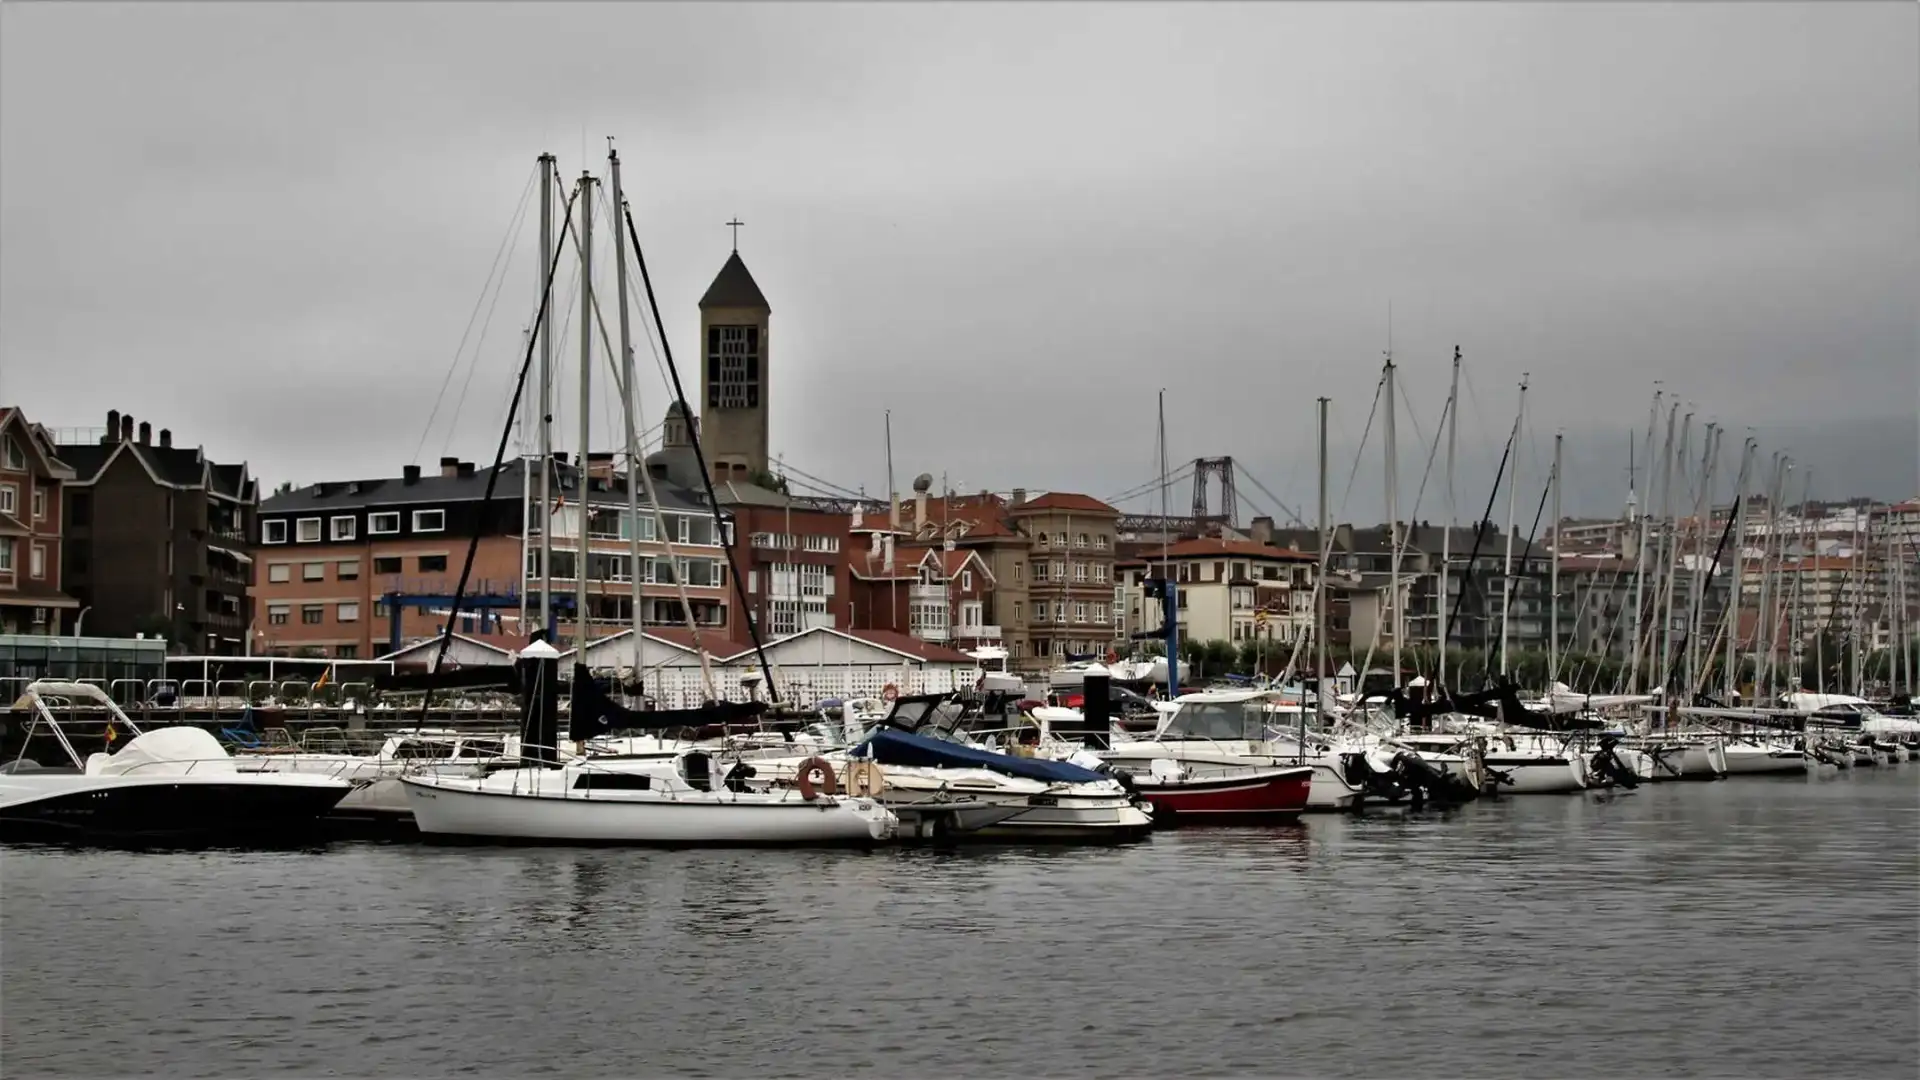
These are the data collected in the "Energy-August 2021," edited by ANEN from the data provided by the General Directorate of the Merchant Navy (Photo Pedro Seoane)
The nautical market is maintained in figures which up to August this year exceed 10% of those reached in 2019. From January to the end of August this year, 5,774 recreational boats have been registered in Spain, compared with 5,232 in the same period in 2019 and 4,463 in the middle of the pandemic last year. Of the total number of registered registrations, 70% are for privately used vessels and 30% for vessels for the nautical charter.
These are the data collected in the"Energy recreational craft market report - August 2021", edited by ANEN on the basis of the data provided by the General Directorate of the Merchant Navy.
The nautical is one of its best seasons and, despite the fact that the logistical problems at the international level are causing delays in the delivery of units in certain markets (nautical motorcycles and certain segments of motor boats), the companies in the sector are preparing to present their new ones in the autumn nautical halls that begin next week with the European meeting in Cannes, to which Genoa and the Barcelona Nautical Hall will continue to open their doors on October 12. These are quotes in which, this year, the international nautical sector is turning, as, after almost two years without face-to-face rooms, the brands and companies are looking forward to showing new developments and trends.
By way of length... all segments grow in the accumulated year... in the comparison with 2019, the smaller boats, up to 8 meters in length, remain the most demanding (87% of the nautical market) and record an 8% increase in their enrolment. The segment between 8 and 12 meters in length accounts for 9% of the market and is growing by 25.5% over the energy period - August 2019. The length between 12 and 16 metres is 14.6% more than the unit and represents 3.1% of the nautical market. The larger vessels, more than 16 metres (representing 1% of the nautical market), have registered 55 units in the period under review and have a growth of 10% over the same period in 2019.
| Length | 2019 | 2020 | 2021 | % ^ 19 | % ^ 20 | % 19 / Tot. | % 20 / Tot. | % 21 / Tot. |
| Up to 6 m | 3,655 | 3.192 | 4,000 | 9.4% | 25.3% | 69.9% | 71.5% | 69.3% |
| 6 to 8 m | 957 | 802 | 1,021 | 6.7% | 27.3% | 18.3% | 18.0% | 17.7% |
| 8 to 12 m | 412 | 325 | 517 | 25.5% | 59.1% | 7.9% | 7.3% | 9.0% |
| 12 to 16 m | 158 | 106 | 181 | 14.6% | 70.8% | 3.0% | 2.4% | 3.1% |
| More than 16 m | 50 | 38 | 55 | 10.0% | 44.7% | 1.0% | 0.9% | 1.0% |
| Total | 5,232 | 4,463 | 5,774 | 10.4% | 29.4% | 100.0% | 100.0% | 100.0% |
In relation to 2019 data by type of vessel, motor vessels are the most demanded (45.8% of the market) and have 20.3% more registration. Water bikes are the next market with the highest demand (26%) but the lowest growth in enrolment (3.3%) due to the lack of stocks.
The registration of sailboats (8% of the nautical market) has grown most in comparison with 2019 (36.3%) in the cumulative year.
The markets for semi-rigid and folding pneumatic vessels are those which, together with the water bikes, have been most affected by delays in delivery as a result of the break of stocks and produce negative data with respect to 2019, -0.2% and -2.2% respectively in enrolment.
| Market | 2019 | 2020 | 2021 | % ^ 19 | % ^ 20 | % 19 / Tot. | % 20 / Tot. | % 21 / Tot. |
| METHODS OF WATER | 1,463 | 1.462 | 1.485 | 1.5% | 1.6% | 28.0% | 32.8% | 25.7% |
| BLOOD TO MOTOR | 2.212 | 1,757 | 2,620 | 18.4% | 49.1% | 42.3% | 39.4% | 45.4% |
| NEUMATIS | 537 | 465 | 525 | -2.2% | 12.9% | 10.3% | 10.4% | 9.1% |
| SEMIRRIGID NEUMATIS | 692 | 491 | 689 | -0.4% | 40.3% | 13.2% | 11.0% | 11.9% |
| VELA | 328 | 288 | 455 | 38.7% | 58.0% | 6.3% | 6.5% | 7.9% |
| Total | 5,232 | 4,463 | 5,774 | 10.4% | 29.4% | 100.0% | 100.0% | 100.0% |
Until the end of August of this year, 1,738 vessels for the charter have been registered in Spain, representing 30% of the total registration of recreational vessels. As far as the year goes, the registration of ships for the nautical charter has grown by 20,5% over the same period of 2019 and 68% over last year... the rental market is still on its upward line.
| Province | 2020 | 2021 | % ^ 20 | % 20 / Tot. | % 21 / Tot. |
| A CORUÑA | 96 | 133 | 38.54% | 2.15% | 2.30% |
| ALAVA | 3 | 3 | 0,00% | 0.07% | 0.05% |
| ALBACETE | 6 | 7 | 16.67% | 0.13% | 0.12% |
| ALICANTE | 294 | 447 | 52.04% | 6.59% | 7.74% |
| ALMERIA | 139 | 208 | 49.64% | 3.11% | 3.60% |
| ASTURIES | 40 | 69 | 72.50% | 0.90% | 1.20% |
| AVILA | 2 | 0 | 100,00% | 0.04% | 0,00% |
| BADAJOZ | 19 | 12 | -36.84% | 0.43% | 0.21% |
| BARCELONA | 422 | 633 | 50,00% | 9.46% | 10.96% |
| BURGOS | 0 | 3 | 0,00% | 0.05% | |
| CACRES | 3 | 2 | -33.33% | 0.07% | 0.03% |
| CADIZ | 184 | 248 | 34.78% | 4.12% | 4.30% |
| CANTABRIA | 83 | 66 | -20.48% | 1.86% | 1.14% |
| CASTELLON | 48 | 79 | 64.58% | 1.08% | 1.37% |
| CEUTA | 20 | 33 | 65.00% | 0.45% | 0.57% |
| REAL CITY | 4 | 8 | 100,00% | 0.09% | 0.14% |
| CORDOBA | 30 | 30 | 0,00% | 0.67% | 0.52% |
| QUENCA | 0 | 1 | 0,00% | 0.02% | |
| GIRONA | 191 | 351 | 83.77% | 4.28% | 6.08% |
| GRANADA | 89 | 108 | 21.35% | 1.99% | 1.87% |
| GUADALAJARA | 13 | 6 | -53.85% | 0.29% | 0.10% |
| GUIPUZCOA | 29 | 34 | 17.24% | 0.65% | 0.59% |
| BELVA | 151 | 207 | 37.09% | 3.38% | 3.59% |
| BESCA | 1 | 1 | 0,00% | 0.02% | 0.02% |
| BALEAR ISLANDS | 870 | 989 | 13.68% | 19.49% | 17.13% |
| JAEN | 10 | 3 | -70,00% | 0.22% | 0.05% |
| THE RIOJA | 5 | 9 | 80,00% | 0.11% | 0.16% |
| THE PALMAS | 101 | 117 | 15.84% | 2.26% | 2.03% |
| LEON | 5 | 4 | -20.00% | 0.11% | 0.07% |
| LLEIDA | 3 | 12 | 300,00% | 0.07% | 0.21% |
| LIGHT | 10 | 23 | 130,00% | 0.22% | 0.40% |
| MADRID | 287 | 373 | 29.97% | 6.43% | 6.46% |
| MALAGA | 277 | 303 | 9.39% | 6.21% | 5.25% |
| MELILLA | 18 | 22 | 22.22% | 0.40% | 0.38% |
| MURCIA | 210 | 251 | 19.52% | 4.71% | 4.35% |
| NAVARRA | 9 | 9 | 0,00% | 0.20% | 0.16% |
| OURENSE | 6 | 4 | -33.33% | 0.13% | 0.07% |
| PALENCY | 2 | 1 | -50,00% | 0.04% | 0.02% |
| PONTEVEDRA | 168 | 155 | -7.74% | 3.76% | 2.68% |
| SALAMANCA | 2 | 5 | 150,00% | 0.04% | 0.09% |
| _ | 141 | 138 | -2.13% | 3.16% | 2.39% |
| SEGOVIA | 2 | 2 | 0,00% | 0.04% | 0.03% |
| _ | 110 | 126 | 14.55% | 2.46% | 2.18% |
| SORIA | 1 | 2 | 100,00% | 0.02% | 0.03% |
| TARRAGONA | 83 | 118 | 42.17% | 1.86% | 2.04% |
| TERUEL | 1 | 0 | 100,00% | 0.02% | 0,00% |
| TOLEDO | 3 | 7 | 133.33% | 0.07% | 0.12% |
| VALENCE | 176 | 266 | 51.14% | 3.94% | 4.61% |
| VALLADOLID | 9 | 3 | -66.67% | 0.20% | 0.05% |
| VIZCAYA | 74 | 120 | 62.16% | 1.66% | 2.08% |
| ZAMORA | 1 | 2 | 100,00% | 0.02% | 0.03% |
| ZARAGOZA | 12 | 21 | 75.00% | 0.27% | 0.36% |
| Total | 4463 | 5774 | 29.4% | 100.0% | 100.0% |
© 2024 Nautica Digital Europe - www.nauticadigital.eu


