Recreation ship enrollments exceed 2019 data by 12 points
Recreation ship enrollments exceed 2019 data by 12 points

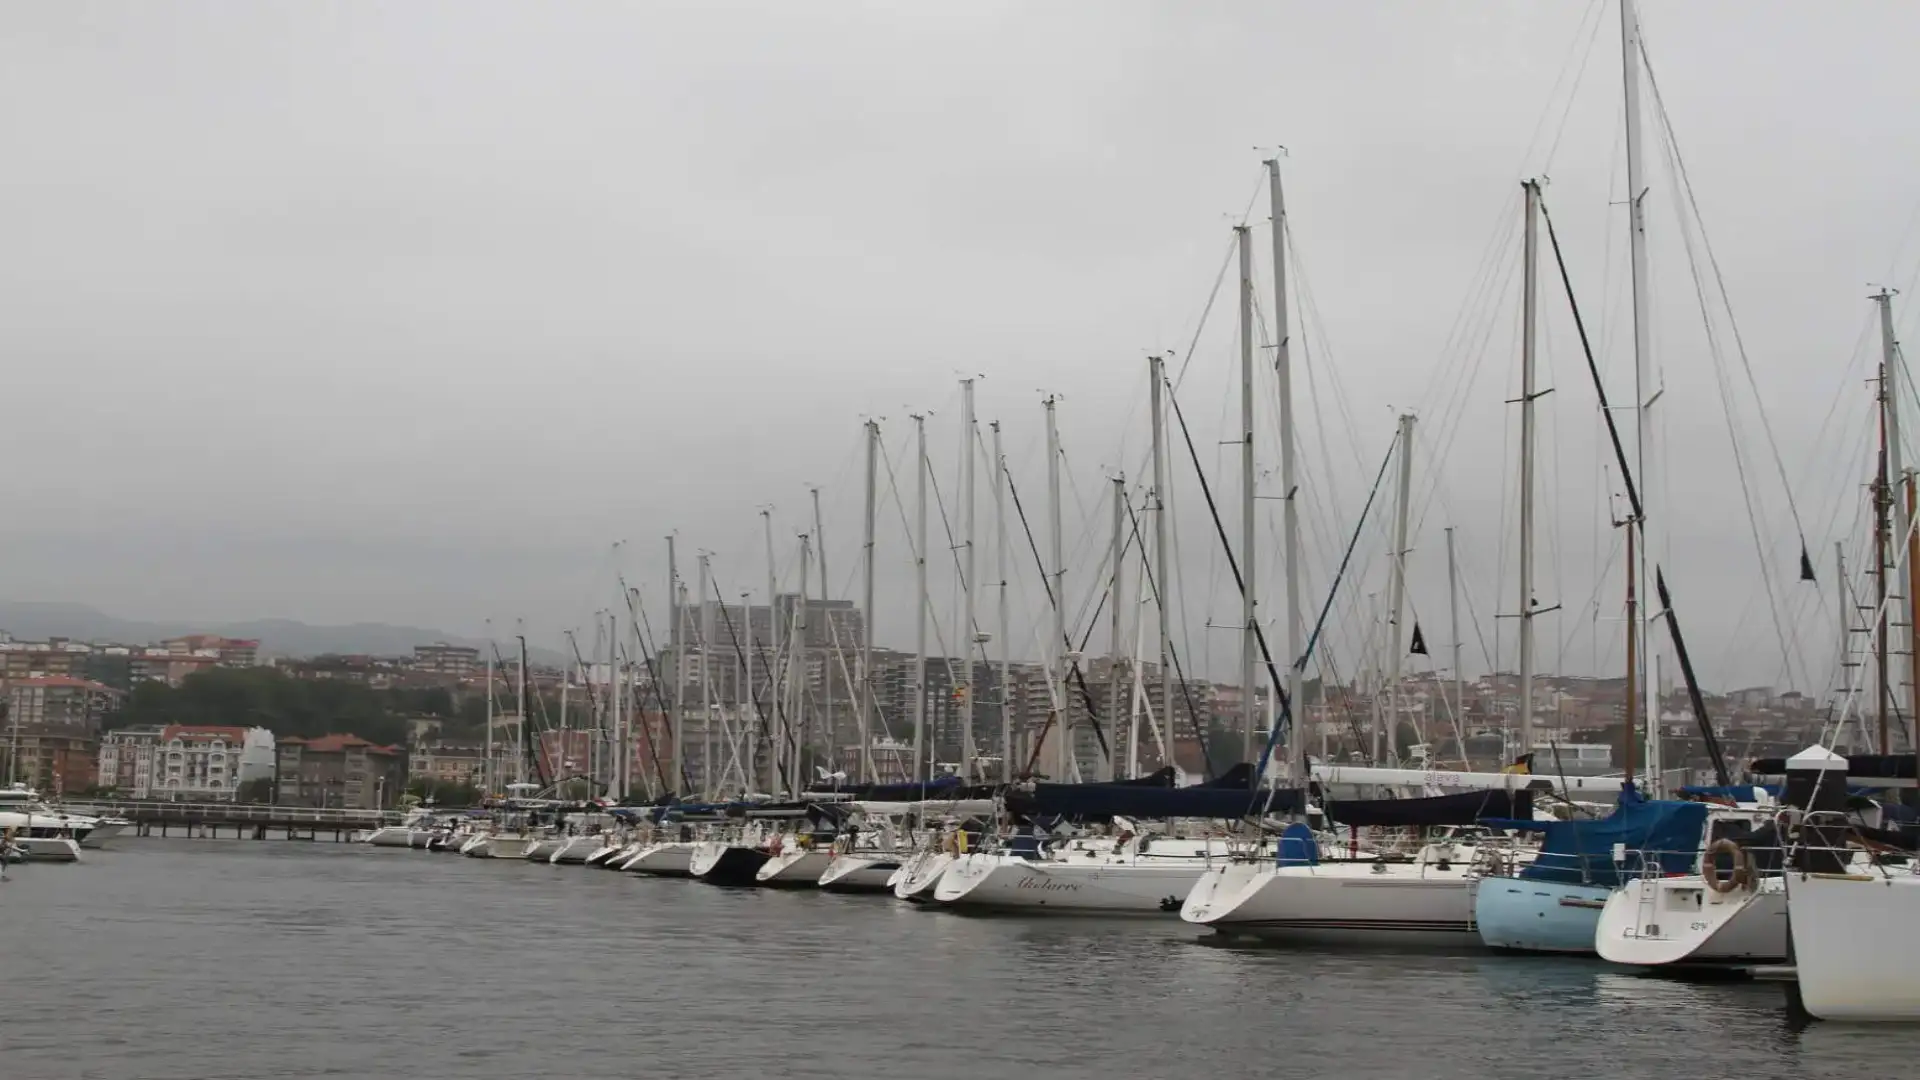
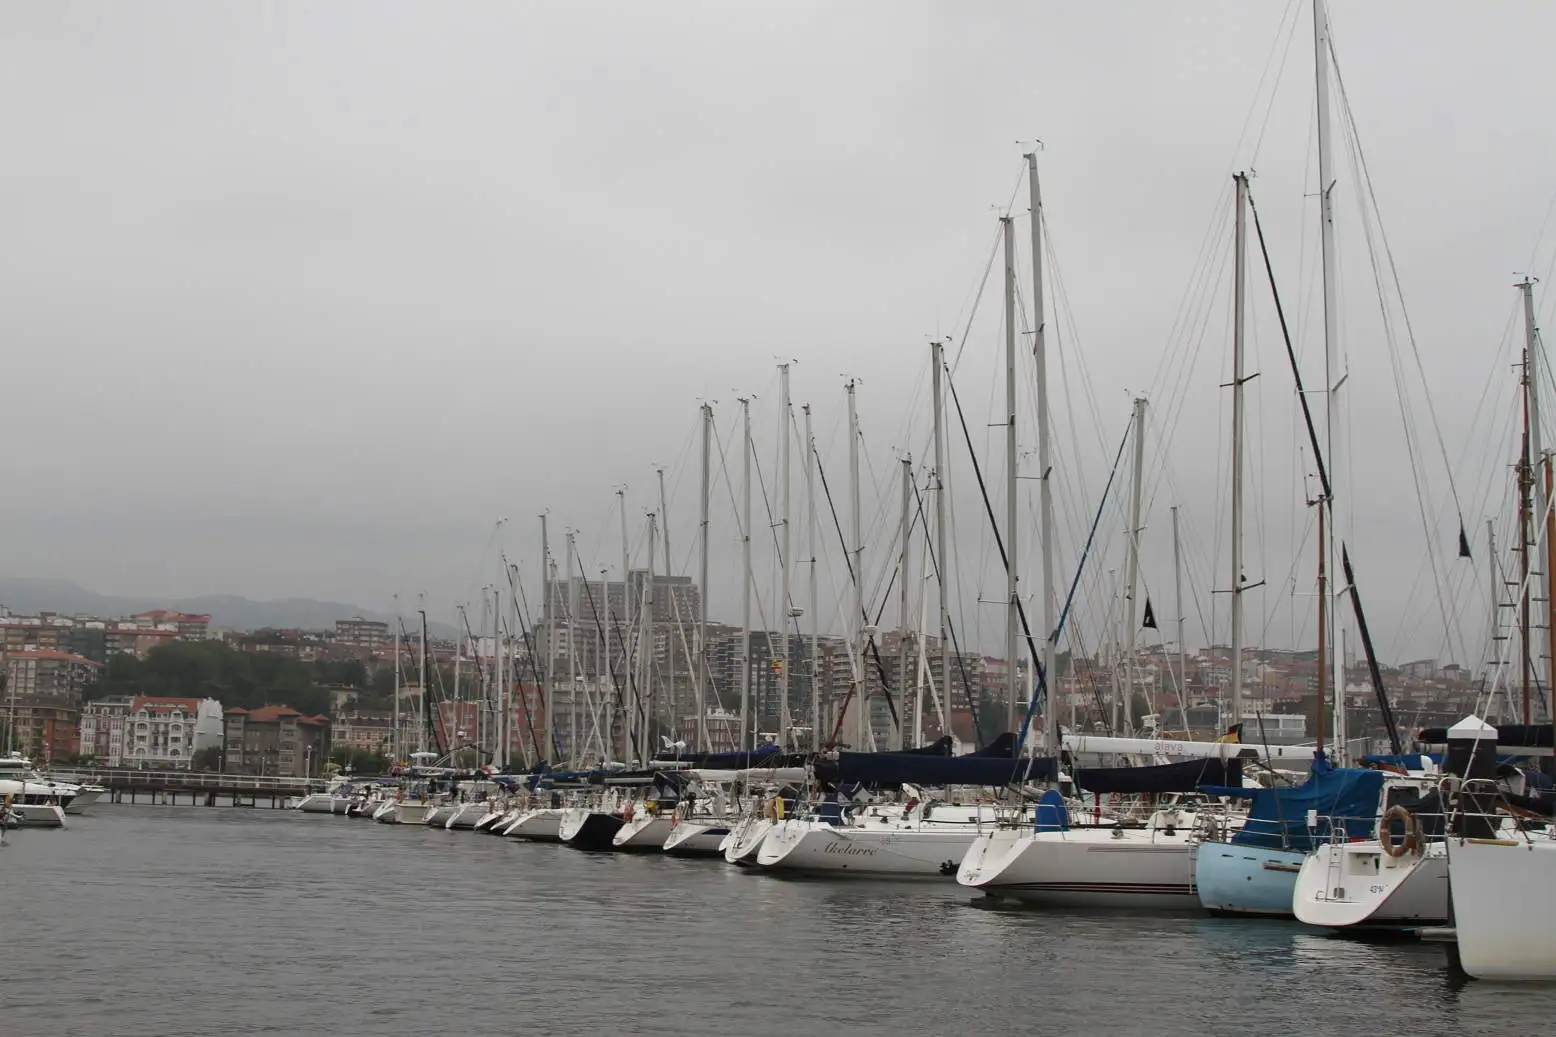
These are the data collected in the Energy-July 2021 Market Report, edited by ANEN from the data provided by the General Directorate of the Merchant Navy (Photo Pedro Seoane)
The nautical market continues to have data above those achieved in 2019. In the EU-July period this year, 5,177 recreational vessels have been registered in Spain, compared with 4,621 in the same period in 2019, an increase of 12%. If we refer to the same period last year, with a sharp fall in the nautical market in the middle of the pandemic, this year's growth is almost 36%.
However, some markets - such as the one of nautical motorcycles and certain segments of motor boats - are being affected by the lack of stocks, at international level, which causes delays in the delivery of recreational boats, a situation that is of concern to companies, which are confident that, with the re-establishment of mobility and the normal functioning of the logistics chain, the 2021 financial year will end in positive and that this growth of the nautical sector will continue in 2022.
NATIONAL NATIC MARKET DATA
By length,grow all segments in the accumulated year. The smaller vessels, up to 8 metres long, remain the most demanding with a share of 87% of the national nautical market.
The segment between 8 and 12 meters of length is 9.8% and the segment between 12 and 16 meters is 3.2% of quota. The larger vessels, more than 16 meters (they account for 1% of the nautical market), have registered 50 units in the period under review and have a growth of 11.1% with a repecto to the same period of 2019, before the COVID crisis' 19.
| Length | 2019 | 2020 | 2021 | % ^ 19 | % ^ 20 | % 19 / Tot. | % 20 / Tot. | % 21 / Tot. |
| Up to 6 m | 3.201 | 2,706 | 3,580 | 11.8% | 32.3% | 69.3% | 71.0% | 69.2% |
| 6 to 8 m | 867 | 700 | 923 | 6.5% | 31.9% | 18.8% | 18.4% | 17.8% |
| 8 to 12 m | 369 | 280 | 460 | 24.7% | 64.3% | 8.0% | 7.3% | 8.9% |
| 12 to 16 m | 139 | 95 | 164 | 18.0% | 72.6% | 3.0% | 2.5% | 3.2% |
| More than 16 m | 45 | 30 | 50 | 11.1% | 66.7% | 1.0% | 0.8% | 1.0% |
| Total | 4,621 | 3,811 | 5.177 | 12.0% | 35.8% | 100.0% | 100.0% | 100.0% |
By type of boat.All markets exceed 2019 data. In comparison with 2020, motor ships continue to grow (+ 59%) and lead the nautical market, with a share of 45.8%. Water bikes are the next market with the highest demand (26%) but with the most content growth (2.4%) due to the lack of stocks.
The registration of sailboats, in the accumulated year, are the ones that have grown the most (+ 63%), a segment that represents 8% of the nautical market.
The registration of semi-rigid tyres, with a market share of 11.7%, is also growing, and the folding pneumatic with 21.8% more registration, account for 8.5% of the market.
| Market | 2019 | 2020 | 2021 | % ^ 19 | % ^ 20 | % 19 / Tot. | % 20 / Tot. | % 21 / Tot. |
| METHODS OF WATER | 1,303 | 1,314 | 1.346 | 3.3% | 2.4% | 28.2% | 34.5% | 26.0% |
| BLOOD TO MOTOR | 1,971 | 1.491 | 2.371 | 20.3% | 59.0% | 42.7% | 39.1% | 45.8% |
| NEUMATIS | 440 | 363 | 442 | 0.5% | 21.8% | 9.5% | 9.5% | 8.5% |
| SEMIRRIGID NEUMATIS | 604 | 391 | 605 | 0.2% | 54.7% | 13.1% | 10.3% | 11.7% |
| VELA | 303 | 252 | 413 | 36.3% | 63.9% | 6.6% | 6.6% | 8.0% |
| Total | 4,621 | 3,811 | 5.177 | 12.0% | 35.8% | 100.0% | 100.0% | 100.0% |
Market rental.Until the end of July of this year, 1,618 vessels have been registered in Spain for the charter, which is 31% of the total registration of recreational vessels. As far as the year goes, the registration of ships for the nautical charter has grown by 22.6% compared to the same period of 2019 and 78.8% with a repecto last year.
Recreation boats by province - July 2021
Source: ANEN with data from the General Directorate of the Merchant Navy
| Province | 2020 | 2021 | % ^ 20 | % 20 / Tot. | % 21 / Tot. |
| A CORUÑA | 79 | 119 | 50.63% | 2.07% | 2.30% |
| ALAVA | 2 | 2 | 0,00% | 0.05% | 0.04% |
| ALBACETE | 6 | 6 | 0,00% | 0.16% | 0.12% |
| ALICANTE | 262 | 404 | 54.20% | 6.87% | 7.80% |
| ALMERIA | 121 | 184 | 52.07% | 3.18% | 3.55% |
| ASTURIES | 36 | 59 | 63.89% | 0.94% | 1.14% |
| AVILA | 2 | 0 | -100,00% | 0.05% | 0,00% |
| BADAJOZ | 19 | 12 | -36.84% | 0.50% | 0.23% |
| BARCELONA | 347 | 558 | 60.81% | 9.11% | 10.78% |
| BURGOS | 0 | 3 | 0,00% | 0.06% | |
| CACRES | 3 | 2 | -33.33% | 0.08% | 0.04% |
| CADIZ | 155 | 221 | 42.58% | 4.07% | 4.27% |
| CANTABRIA | 65 | 63 | -3.08% | 1.71% | 1.22% |
| CASTELLON | 41 | 68 | 65.85% | 1.08% | 1.31% |
| CEUTA | 19 | 32 | 68.42% | 0.50% | 0.62% |
| REAL CITY | 3 | 8 | 166.67% | 0.08% | 0.15% |
| CORDOBA | 25 | 23 | -8.00% | 0.66% | 0.44% |
| QUENCA | 0 | 1 | 0,00% | 0.02% | |
| GIRONA | 169 | 314 | 85.80% | 4.43% | 6.07% |
| GRANADA | 77 | 94 | 22.08% | 2.02% | 1.82% |
| GUADALAJARA | 10 | 5 | -50,00% | 0.26% | 0.10% |
| GUIPUZCOA | 26 | 29 | 11.54% | 0.68% | 0.56% |
| BELVA | 139 | 193 | 38.85% | 3.65% | 3.73% |
| BESCA | 1 | 1 | 0,00% | 0.03% | 0.02% |
| BALEAR ISLANDS | 736 | 902 | 22.55% | 19.31% | 17.42% |
| JAEN | 9 | 3 | -66.67% | 0.24% | 0.06% |
| THE RIOJA | 5 | 8 | 60,00% | 0.13% | 0.15% |
| THE PALMAS | 76 | 98 | 28.95% | 1.99% | 1.89% |
| LEON | 4 | 4 | 0,00% | 0.10% | 0.08% |
| LLEIDA | 3 | 11 | 266.67% | 0.08% | 0.21% |
| LIGHT | 8 | 19 | 137.50% | 0.21% | 0.37% |
| MADRID | 245 | 330 | 34.69% | 6.43% | 6.37% |
| MALAGA | 231 | 276 | 19.48% | 6.06% | 5.33% |
| MELILLA | 17 | 20 | 17.65% | 0.45% | 0.39% |
| MURCIA | 192 | 231 | 20.31% | 5.04% | 4.46% |
| NAVARRA | 5 | 8 | 60,00% | 0.13% | 0.15% |
| OURENSE | 5 | 4 | -20.00% | 0.13% | 0.08% |
| PALENCY | 2 | 1 | -50,00% | 0.05% | 0.02% |
| PONTEVEDRA | 156 | 131 | -16.03% | 4.09% | 2.53% |
| SALAMANCA | 1 | 5 | 400,00% | 0.03% | 0.10% |
| _ | 110 | 129 | 17.27% | 2.89% | 2.49% |
| SEGOVIA | 2 | 2 | 0,00% | 0.05% | 0.04% |
| _ | 96 | 113 | 17.71% | 2.52% | 2.18% |
| SORIA | 0 | 1 | 0,00% | 0.02% | |
| TARRAGONA | 69 | 102 | 47.83% | 1.81% | 1.97% |
| TERUEL | 1 | 0 | -100,00% | 0.03% | 0,00% |
| TOLEDO | 3 | 6 | 100,00% | 0.08% | 0.12% |
| VALENCE | 148 | 238 | 60.81% | 3.88% | 4.60% |
| VALLADOLID | 7 | 3 | -57.14% | 0.18% | 0.06% |
| VIZCAYA | 64 | 111 | 73.44% | 1.68% | 2.14% |
| ZAMORA | 0 | 2 | 0,00% | 0.04% | |
| ZARAGOZA | 9 | 18 | 100,00% | 0.24% | 0.35% |
| Total | 3811 | 5177 | 35.8% | 100.0% | 100.0% |
© 2024 Nautica Digital Europe - www.nauticadigital.eu


