


The demand for recreational boats continues to rise in the near summer
The demand for recreational boats continues to rise in the near summer
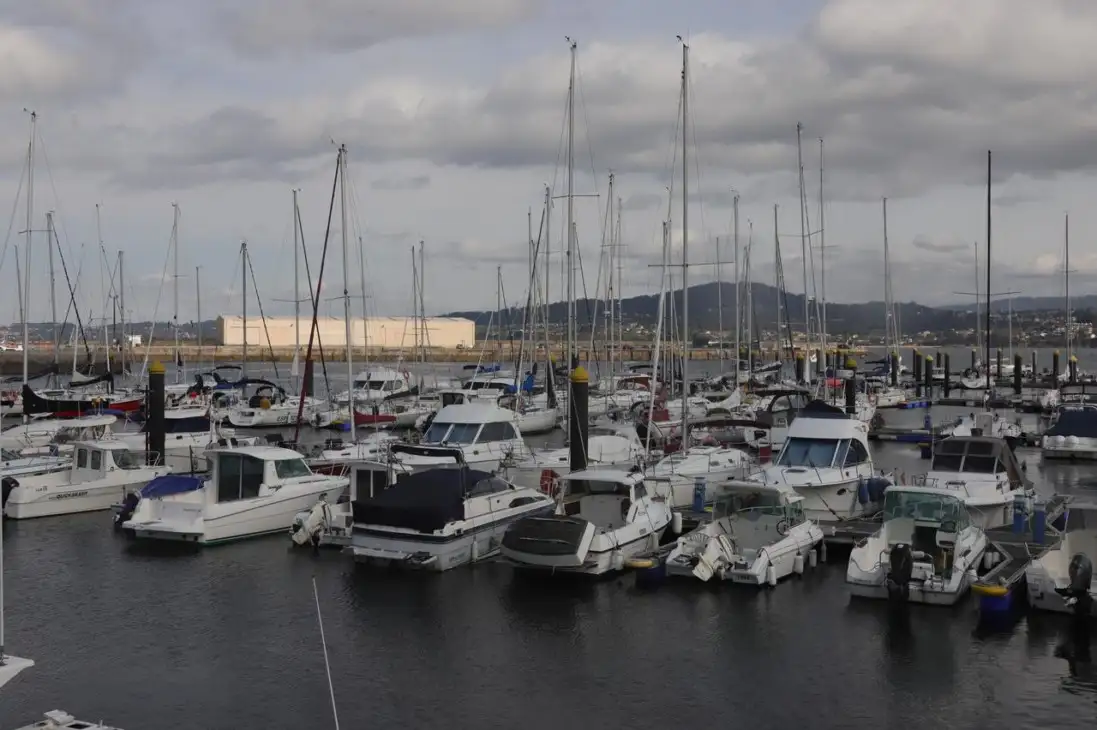
These are the data collected in the -Recreation boat market report. Enero- May 2021-, edited by Anen from the data provided by the General Directorate of the Merchant Navy (Photo Pedro Seoane)
Between January and May, 2,857 recreational vessels were registered in Spain compared with 1,400 registered in the same period in 2020 and 2,466 in 2019.
The proximity of summer and the security provided by recreational navigation since we are in a pandemic situation, places the sale and rental of recreational ships in figures above those reached before the pandemic crisis.
In the period under review, enrolment growth is 104% over the same period in 2020, when the nautical market fell by 43% due to the impact of the pandemic. For the same period in 2019, enrolment has increased by 15.86% this year.
Of the total number of registered registrations between January and May, 70% are for vessels for private use, while 30% are for vessels for the nautical charter.
NATIONAL NATIC MARKET DATA
By length,All segments in the year's accumulated increase significantly. The smaller boats, up to 8 meters long, grow on average 102% and remain the most demanding with a share of 85.5% of the nautical market.
Between 8 and 12 metres in length, the registration of vessels is growing by 98.6%. In the segment between 12 and 16 meters, the enrolments grow by 112% and the ships over 16 meters reach a growth of 158.3% (it should be noted that these two segments account for 3.7% and 1.1% of the nautical market, respectively).
| Length | 2019 | 2020 | 2021 | % ^ 19 | % ^ 20 | % 19 / Tot. | % 20 / Tot. | % 21 / Tot. |
| Up to 6 m | 1,658 | 933 | 1,914 | 15.4% | 105.1% | 67.2% | 66.6% | 67.0% |
| 6 to 8 m | 476 | 265 | 528 | 10.9% | 99.2% | 19.3% | 18.9% | 18.5% |
| 8 to 12 m | 224 | 140 | 278 | 24.1% | 98.6% | 9.1% | 10.0% | 9.7% |
| 12 to 16 m | 83 | 50 | 106 | 27.7% | 112.0% | 3.4% | 3.6% | 3.7% |
| More than 16 m | 25 | 12 | 31 | 24.0% | 158.3% | 1.0% | 0.9% | 1.1% |
| Total | 2,466 | 1,400 | 2,857 | 15.9% | 104.1% | 100.0% | 100.0% | 100.0% |
By type of boat.Motor ships, with an increase in registration of 123%, lead the market as well as the most demanding vessels (46.7% share). It is followed by the semi-rigid tyres that increase its enrolment by 119% and the sailboats that grow by 110%. The following are the folding pneumatic vessels (+ 93%) and the water bikes (+ 73%).
| Market | 2019 | 2020 | 2021 | % ^ 19 | % ^ 20 | % 19 / Tot. | % 20 / Tot. | % 21 / Tot. |
| METHODS OF WATER | 606 | 418 | 723 | 19.3% | 73.0% | 24.6% | 29.9% | 25.3% |
| BLOOD TO MOTOR | 1.122 | 598 | 1.334 | 18.9% | 123.1% | 45.5% | 42.7% | 46.7% |
| NEUMATIS | 217 | 112 | 216 | -0.5% | 92.9% | 8.8% | 8.0% | 7.6% |
| SEMIRRIGID NEUMATIS | 339 | 141 | 309 | -8.8% | 119.1% | 13.7% | 10.1% | 10.8% |
| VELA | 182 | 131 | 275 | 51.1% | 109.9% | 7.4% | 9.4% | 9.6% |
| Total | 2,466 | 1,400 | 2,857 | 15.9% | 104.1% | 100.0% | 100.0% | 100.0% |
Recreation boats by province - Enero- May 2021
Source: ANEN with data from the General Directorate of the Merchant Navy
| Province | 2020 | 2021 | % ^ 20 | % 20 / Tot. | % 21 / Tot. |
| A CORUÑA | 30 | 59 | 96.67% | 2.14% | 2.07% |
| ALAVA | 1 | 1 | 0,00% | 0.07% | 0.04% |
| ALBACETE | 1 | 3 | 200.00% | 0.07% | 0.11% |
| ALICANTE | 69 | 239 | 246.38% | 4.93% | 8.37% |
| ALMERIA | 43 | 86 | 100,00% | 3.07% | 3.01% |
| ASTURIES | 6 | 17 | 183.33% | 0.43% | 0.60% |
| AVILA | 2 | 0 | -100,00% | 0.14% | 0,00% |
| BADAJOZ | 11 | 7 | -36.36% | 0.79% | 0.25% |
| BARCELONA | 130 | 305 | 134.62% | 9.29% | 10.68% |
| BURGOS | 0 | 1 | 0,00% | 0.04% | |
| CACRES | 1 | 1 | 0,00% | 0.07% | 0.04% |
| CADIZ | 58 | 137 | 136.21% | 4.14% | 4.80% |
| CANTABRIA | 23 | 30 | 30.43% | 1.64% | 1.05% |
| CASTELLON | 19 | 43 | 126.32% | 1.36% | 1.51% |
| CEUTA | 4 | 19 | 375.00% | 0.29% | 0.67% |
| REAL CITY | 2 | 5 | 150,00% | 0.14% | 0.18% |
| CORDOBA | 11 | 13 | 18.18% | 0.79% | 0.46% |
| QUENCA | 0 | 0 | 0,00% | 0,00% | |
| GIRONA | 58 | 146 | 151.72% | 4.14% | 5.11% |
| GRANADA | 22 | 38 | 72.73% | 1.57% | 1.33% |
| GUADALAJARA | 7 | 1 | -85.71% | 0.50% | 0.04% |
| GUIPUZCOA | 9 | 13 | 44.44% | 0.64% | 0.46% |
| BELVA | 55 | 119 | 116.36% | 3.93% | 4.17% |
| BESCA | 0 | 1 | 0,00% | 0.04% | |
| BALEAR ISLANDS | 281 | 507 | 80.43% | 20.07% | 17.75% |
| JAEN | 2 | 1 | -50,00% | 0.14% | 0.04% |
| THE RIOJA | 2 | 1 | -50,00% | 0.14% | 0.04% |
| THE PALMAS | 36 | 59 | 63.89% | 2.57% | 2.07% |
| LEON | 2 | 1 | -50,00% | 0.14% | 0.04% |
| LLEIDA | 2 | 4 | 100,00% | 0.14% | 0.14% |
| LIGHT | 4 | 10 | 150,00% | 0.29% | 0.35% |
| MADRID | 83 | 168 | 102.41% | 5.93% | 5.88% |
| MALAGA | 98 | 164 | 67.35% | 7.00% | 5.74% |
| MELILLA | 8 | 15 | 87.50% | 0.57% | 0.53% |
| MURCIA | 75 | 117 | 56.00% | 5.36% | 4.10% |
| NAVARRA | 2 | 4 | 100,00% | 0.14% | 0.14% |
| OURENSE | 2 | 2 | 0,00% | 0.14% | 0.07% |
| PONTEVEDRA | 53 | 79 | 49.06% | 3.79% | 2.77% |
| SALAMANCA | 1 | 1 | 0,00% | 0.07% | 0.04% |
| _ | 37 | 96 | 159.46% | 2.64% | 3.36% |
| SEGOVIA | 1 | 1 | 0,00% | 0.07% | 0.04% |
| _ | 31 | 56 | 80.65% | 2.21% | 1.96% |
| SORIA | 0 | 0 | 0,00% | 0,00% | |
| TARRAGONA | 27 | 59 | 118.52% | 1.93% | 2.07% |
| TERUEL | 0 | 0 | 0,00% | 0,00% | |
| TOLEDO | 0 | 1 | 0,00% | 0.04% | |
| VALENCE | 57 | 152 | 166.67% | 4.07% | 5.32% |
| VALLADOLID | 5 | 2 | -60,00% | 0.36% | 0.07% |
| VIZCAYA | 25 | 64 | 156.00% | 1.79% | 2.24% |
| ZAMORA | 0 | 2 | 0,00% | 0.07% | |
| ZARAGOZA | 4 | 7 | 75.00% | 0.29% | 0.25% |
| Total | 1400 | 2857 | 104.1% | 100.0% | 100.0% |
© 2024 Nautica Digital Europe - www.nauticadigital.eu


